rss
email
twitter
facebook

Friday, July 30, 2010

Gross Domestic Product


GDP = Consumption + Foreign Direct Investment + Government Expenditures + Net Exports

Second quarter GDP came in at an annualized 2.4 percent growth, following a revised first quarter gain of 3.7 percent. Today's release includes annual revisions going back three years. The second quarter advance estimate is just barely below analysts' projections for a 2.5 percent increase. But the first quarter upward revision of a full percentage point from the prior estimate of 2.7 percent is a positive surprise.

The latest quarter was led by a rebound in residential investment, a jump in investment in equipment & software, and by inventories. PCEs also posted a moderate gain along with government purchases. The big negative is a worsening in net exports.

Bloomberg.com


Equities tanked early in the trading session, but managed to eke out minimal gains by the close. I did not execute any trades today. However, I simulated some options trades with GLD and SLV. Needless to say, the new strategies look good. Look for M&A news on Sunday to boost equities on Monday morning. Have a great weekend!

Patrick M. Ambrus
Analyze Capital LLC
Twitter: Analyze Capital

Tuesday, July 27, 2010

Consumer Confidence


Consumer confidence dipped in July-again over worries about the jobs picture and over income prospects. The overall consumer confidence index slipped to 50.4 in July from an upwardly revised 54.3 in June (initially 52.9). Analysts projected July to print at 51.0. The latest decrease was led by a drop in expectations to 66.6 from 72.7 in June. But the present situation sub-index also declined-to 26.1 from 26.8.

Those seeing jobs as hard to get rose to 45.8 percent in July from 43.5 percent the prior month. On the issue of expectations of income, 17.5 percent see income down in six months, compared to 16.8 percent in June. Only 10 percent expect higher income in six months, compared to 10.6 percent in June.

The good news, however, is that buying plans have picked up in some categories-albeit from low levels. Those planning to buy a car within six months rebounded to 4.5 percent from 4.1 percent in June. Those planning to buy a major appliance within six months jumped to 28.5 percent in July from 23.7 percent in June. However, those planning to purchase a house edged down to 1.9 percent from 2.0 percent in June.


Patrick M. Ambrus
Analyze Capital LLC
Twitter: AnalyzeCapital

Californication: More Problems in Cali- Part Deux


The California budget project, a think tank, indicates that the states university system remains the largest employer at 38%, however no one wants to make any cuts in that sector because of the powerful teachers union (the largest lobby in the state) that is vehemently opposed to any new measures to raise standards, change probation periods, and alter the ‘laughably easy teacher tests’ which dictate hiring. The State has the largest classrooms with 23.4 students, almost twice the national average, and spending per pupil has dropped 11% in the past two years and is likely to drop even further now that the stimulus package has run out. And, considering that the states 8th graders ranked 46th in the nation last year as well as the fact that the state sends fewer high school graduates to college than all but three other states, there are many arguments for reorganizing the entire education system, however the possibility of that becoming reality remains improbable.

Consequently, the school system is not the only pressing issue of economic consequence. The rich and fertile central valley of California is running out of its most valuable resource, water. Geologically the region was once, thousands of years ago, an inland sea, however now the cumulative abuse of resources and successive droughts since 2006 have severely reduced the natural water supply. Importing water has increased the cost of acquiring the resource for local farmers, which is now accounting to above 30% of their expenditures. Even the use of “micro-sprinklers”, aimed at helping reduce water waste, has had little overall effect. While it is unlikely that farming will disappear entirely from the region, whether it will be as productive as it was in years past remains unclear. In the San Joaquin valley agriculture accounts for 20% of the available jobs, the only other comparable source being the state prison system. And, because of the very poor level of education among the workers in the valley, opportunities would be scare if many are left without work in the fields. The demographic trend of increasing Spanish speaking workers, now reaching close to 6.8 million, who migrate to the valley add to the already pressing problem of few opportunities and increasing water costs.

Much like the problematic issues facing Sacramento and the central valley face, the city of Los Angles also has many enormous budget cuts to deal with in order to decrease its deficits of close to $212 million. Next year Wendy Gruel, the cities chief accountant, estimates that the deficit may increase to $484 million and with the power and water utilities refusing to transfer funds to the city’s general fund LA’s accounts will be overdrawn, leaving little available cash to pay its employees. On top of a state-wide housing bust and complicated property taxes, including proposition 13 which capped property taxes in 1978, the city has few viable resources for generating any necessary funds. In addition, proposition 218 was passed in 1996 requiring explicit voter approval for increasing any of the cities fees, further complicating the city’s fiscal issues. The only option the city now has is cutting the size of its services. And, in the case of the police force which was once lauded for its hard-won success against crime, chief of police Charlie Beck has cut overtime pay and will potentially limit hiring next year. As with the state, the future of Los Angles looks bleak and is due a real miracle if it is resolve its deepening fiscal issues.

Cited form the Economist Magazine, Website & Bloomberg.com

Tom Rodelli
Research Analyst
Analyze Capital LLC
trrodelli@gmail.com

Monday, July 26, 2010

Victoria Concordia Crescit


Victory! Today I had the best P&L day of the year. On July 14, I was stopped out of my NG position at $4.34. Then on June 15th I watched NG rocket up from 4.31 to 4.60. Needless to say I was upset.

On Friday July 16, I decided to get long a double-digit amount of ES (E-mini SPX) contracts at around 1070 with 1100 price target in mind. By the close my position was underwater 1%. However, I learned my lesson from the NG trade and stuck to my guns by setting a looser S/L. This increased my risk/reward ratio, however, I felt very confident my position would rally.

Last week, I monitored my position less frequently than normal, as I was in Japan conducting some business with my partner Clark. Thus, I adjusted my stops accordingly each day and was able to let my profits ride. On Friday, I thought about selling but decided to juice my trade out until the resistance levels of about 1110.

Today, I made the right decision. I locked in a 3.6% profit. Weather or not my position continues to rally is irrelevant. I am proud of my ability to macro-manage my trade with careful risk management in place. This was not only my best P&L day of the year, but also my most disciplined trade.

I owe this successful trade not just to myself but also to my family, partners, business associates, and fellow traders who helped me clarify my thoughts everyday. Thank you all.

Music Selection: If you are into Hip Hop music I suggest Rick Ross’ new album Teflon Don. Up-tempo and soulful sound mixed with hard street bangers. Maybach Music.

Related ETFs: ProShares Ultra S&P 500 (SSO:US), SPDR S&P 500 ETF Trust (SPY:US)


Patrick M. Ambrus
Analyze Capital LLC
Twitter: AnalyzeCapital

Analysis of the European Bank Stress Tests


Analysis:
Here are some headlines that I saw after the European bank stress tests were revealed:
“Euro Bears Vanish as Stress End Makes Goldman a Bull” (Bloomberg)
“Spanish, Other European Banks Rise After Stress Test Results‎” (WSJ)
“Vast majority of EU banks pass stress tests” (Yahoo)

Despite these positive-sounding headlines, the truth is that the stress tests were not tough enough. According to the results, seven banks lack adequate reserves to maintain a Tier 1 capital ratio of at least 6% in the event of a recession and sovereign-debt crisis. Among the banks, one is German, one is Greek, and five are Spanish. Furthermore, the tests concluded that the banks would only need to raise 3.5 billion euros ($4.5 billion) of capital. For many investors, these numbers sound too good to be true.

Bringing a bit of reality to the picture, Morgan Stanley’s head of European credit strategy claims that had the Tier 1 threshold been 7%, 24 of the banks would have failed. Another criticism coming from investors is that the tests ignore the majority of sovereign debt that banks hold. The bank exams only took a look at the trading books and ignored the banking books. In other words, the evaluations took into account potential losses only on government bonds that the banks trade, rather than those they are holding until maturity. This is a major problem because, according to a survey by Morgan Stanley, lenders hold about 90% of their Greek government bonds in their banking book and 10% in their trading book. Also, the tests assumed a loss of 23.1% on Greek debt, 14% on Portuguese debt, 12.3% on Spanish debt, 4.7% on German debt, 10% on UK debt, and 5.9% on French debt.

On the other hand, some argue that the very existence of the stress tests is a good sign. This is because it forces European national bank regulators to work with each other and keep a closer eye on troubled banks. Additionally, some say that the tests make it more likely that the government will bail out banks if needed. The argument is that government is more inclined to make good on its claim with a bailout if a so-called “safe” bank is about to fail.

Conclusion:

In my opinion, the stress tests do little to bring about certainty to the eurozone. In light of the tests, I am not convinced that the euro will break through 1.30 in the next few weeks. However, with that being said, the euro may continue to defy the odds and finish this month up strong.

Information obtained from Bloomberg and other news sources.

Daniel A.
Summer Analyst
Analyze Capital LLC
analyzecapital@gmail.com

The Golden State- Part 1


There are many reasons to compare the State of California with the small European nation of Greece besides their warm Mediterranean climates. Like Greece, the Golden State has become a symbol of fiscal irresponsibility, in effect spending what it cannot pay for through taxes. And, although there is no serious need to worry about the state defaulting on its debt; rating agencies consider that risk in California to be greater than all the other 49 states.

Even after a decade of passing measures to cut spending, the state is once again considering a new budget, proportionally smaller to what is was a decade ago after taking into account population growth and inflation. And, even then the state still faces a $17.9 budget hole in the current and coming fiscal years. To produce more cash, without raising taxes, California will be forced to cut whole programs including welfare-to-work, subsidized child care, and the cash assistance to poor families with children. Reducing overgenerous state employee pensions costing the state over $6 billion a year remains a priority, as well as initiating an alternative budgetary system proposed by bi-partisan leadership last year that introduces a new value-added tax, simplifies income taxes, and scraps more from corporate and sales taxes. Part of the state’s problematic tax issues revolves around the ineffective proposition 13 of 1978 which fails to raise enough money from property taxes for local municipalities. On top of that, Proposition 98 of 1988 was meant to find new ways of generating funds, but it’s horrendously complex mathematical systems and funding formulas have never produced positive results.

California faces a more general problem as the political structure ensures spending will always outpace revenues. While simple majorities in Sacramento are required to lower taxes, super majorities must agree to increase them. The recent primary elections for the governor’s seat in California have highlighted new ideas on spending reductions in various sectors of the government, however statistics in 2008 indicated that California had 108 state employees for every 10,000 residents, a ratio which remains one of the lowest in the United States, only Florida and Illinois have fewer. Where the incumbent governor can realistically cut jobs remains unclear. Recently, Governor Schwarzenegger has initiated measures to cut the state’s employee pay to minimum wage. Although this may help ease the state’s economic problems it seems rather controversial that a few must suffer the irresponsibility’s of an entire society. There will come a time when the taxes will have to be increased, and presently it seems we are once again prolonging the inevitable for immediate political safety.

Tom Rodelli
Research Analyst
Analyze Capital LLC
trrodelli@gmail.com

Thoughts on Transition


Last week was a week of transition; global Equity prices resumed their rally, “Helicopter Ben” and his contrarian co-pilots hinted at more Quantitative Easing, and The Financial Times unleashed a scrumptious morsel of protein packed debates on austerity vs. stimulus from bloodthirsty alpha-economists. What else is new?

Circumstances and situations change fast:

1. BP Gulf Oil Spill- Tony Hayward gone
2. Goldman Sachs – mediocre earnings
3. Euro Stress Tests- unleashed

Who cares, right!? The aforementioned circumstances defiantly dominated the financial, economic, business, and global-political headlines for the better part of the second quarter all while instilling fear, scandal, and panic into the hearts’ of ubiquitous market participants. Which stories will produce future catalysts that influence future irrational behavior of financial markets? Rather, what’s next?

I cannot say for sure or even offer a robust prediction. My lone thought; politicians will scrutinize the U.S. economic recovery. Midterm elections draw near. It is almost time for another round of Obamanomics. Here are a few things to be mindful of while trading this week:

• Consumer Confidence (Tuesday)

• Durable Goods Orders (Wednesday)

• C + I + G + X (Friday)


Globalization creates interlocking fragility, while reducing volatility and giving the appearance of stability. In other words it creates devastating Black Swans. We have never lived before under the threat of a global collapse.

--N.N. Taleb


Patrick M. Ambrus
Analyze Capital LLC
Twitter: AnalyzeCapital

Tuesday, July 20, 2010

IEA: China now the world's largest energy consumer


China Surpasses the U.S.:
As many news outlets are now reporting, according to the International Energy Agency, China surpassed the United States as the world’s largest energy consumer in 2009. China consumed 2,252 million metric tons of oil equivalent in 2009, while the U.S. used 2,170 million tons. This estimate is in line with BP Plc’s Statistical Review of World Energy, which was released in June. Surprisingly, China rejected the IEA report, claiming that the IEA’s data is unreliable.

Amazingly, China’s total energy consumption was just half the size of the U.S. 10 years ago. The latest numbers are an indication of China’s robust growth and how the global recession hit the U.S. more severely than China. On a per capita basis, however, the US still uses far more energy than China and remains less efficient than Europe.

IEA Chief Economist Fatih Birol stated, “As China overtakes the U.S. as the world’s largest energy consumer, it is not only a domestic issue for China, but has repercussions for the rest of the world not only in supply terms, but also in how the energy is consumed…If China uses electric cars, hybrids and so on, they will impose the manufacturing line on most of the rest of the world.”

Global oil supplies will become “tighter” after 2015 as a result of declining production outside the Organization of Petroleum Exporting Countries, and growing control of reserves by state-run producers, Birol said.

Investment Idea:

Investors who are interested in China’s energy sector should consider the Global X China ETF (CHIE). This ETF, which was introduced on December 15, 2009, has the following breakdown:

Oil & Gas, 43.56%
Alternative Energy, 22.42%
Electric, 14.11%
Coal, 13.7%
Energy Equipment & Services, 6.13%

At $13.11 per share, now may be the time to buy. This is supported by additional news that “China is likely to consume about 11 percent more electricity this year than in 2009” (Reuters) and that the country “may spend about 5 trillion yuan ($738 billion) in the next decade developing cleaner sources of energy” (Businessweek).

Conclusion:

With China and other developing nations on the rise, the question right now is not “if” global energy prices will rise, it is “when.” With economic recovery lagging in the U.S. and Europe, I believe that prices will rise at a slow pace at best for at least the next six months. If we see greater certainty in economic conditions in 2011, I predict that we will see a boom in energy prices by 2012.

Daniel A.
Summer Analyst
Analyze Capital LLC
analyzecapital@gmail.com

Saturday, July 17, 2010

Update on GBP and EUR: July 17, 2010

Remember How I wrote that POST <-- on how the GBP was leading the EUR and possibly the major pairs.

Well if that is true…


I came across this on my buzz updates, thank you Mustafa Abdel-Rhaman and I guess via forexcycle.com

If the sterling is really leading the crowd then we will see higher highs into next week on the EUR as well. I can think of no strong fundamental reason for such a higher move. The sentiment I got from scouring the web was that many players are on the fence expecting the EUR to top out at 1.30. Well perhaps we will get a top out at 1.30 with a higher low continued to a higher high following the Pound.

The EUR has been highly sentimental and technically oriented the past weeks, and should continue to be so considering the high amounts of uncertainty in the world economies.

After making a really poor trade followed by a really good trade on the EUR. I will continue to monitor the situation and look for daily ST (short term) opportunities.

**more on my trades later.


-----

Alexander Lê
Managing Partner
Analyze Capital LLC
analyzecapital@gmail.com

Friday, July 16, 2010

Who Owns American Debt: July 16, 2010

I came across this while on digg.com. A infograph that breaks down of exactly who owns American Debt. Read it and eat it boys and girls!

Budget Plannerfrom Mint.com


CLICK HERE FOR FULL GRAPH

----

Alexander Lê
Managing Partner
Analyze Capital LLC
analyzecapital@gmail.com

Equity Update: July 16, 2010


Motorola Is Willing To Break the Phone They Just Sold You

Read Article Above ^^^^

Look at todays price action on MOT. Coincidence or are markets relatively efficient? Or is this just complete nonsense? You tell me…


-----


6 month aapl daily

Short aapl to 225 range. That is given….


However the real test can be seen on the weekly chart. 225 coincides with RSI 50 weekly support along with 50 SMA weekly support. Will all this negative sentiment and iphone4 press conference contribute to apples fall …. to say 150?


For now I'd continue to short to 225 and assess the damage to come at those levels.

**note** I'll be watching the volume carefully


----

Alexander Lê
Managing Partner
Analyze Capital LLC
analzecapital@gmail.com

Thursday, July 15, 2010

PPI, Industrial Production, Deflation, and Hypothetical Bantar


PPI
Lower food costs unexpectedly weighed on producer prices with energy also helping. Overall PPI inflation fell 0.5 percent, following a 0.3 percent drop in May. The June decrease was larger than the market consensus forecast for a 0.1 percent decline. At the core level, the PPI eased to 0.1 percent from a 0.2 percent boost in May. Analysts projected a 0.1 percent rise.

For the overall PPI, the year-on-year rate decelerated to 2.7 percent from 5.1 percent in May (seasonally adjusted). The core rate eased to 1.0 percent from 1.3 percent the month before. On a not seasonally adjusted basis for June, the year-ago increase for the headline PPI was up 2.8 percent while the core was up 1.1 percent.

Bloomberg.com


Industrial Production
After almost a year of strong gains, industrial production slowed in June. And it would have been negative without a surge in utilities output-likely weather related. Overall industrial production in June edged up 0.1 percent, following a 1.3 percent gain the prior month. The June increase was above the market forecast for a 0.2 percent drop.

However, manufacturing fell 0.4 percent in June, following a 1.0 percent jump in May. For other sectors in June, utilities output was up 2.7 percent while mining gained 0.4 percent.

Bloomberg.com


Is deflation imminent in the near future? This question resides on the collective brain-power of the FOMC. In addition, Empire State Manufacturing released today reported a slow down in growth led by a decline in new factory orders and shipments. There are three things to do with this data:

1. Ignore it.
2. Wait and seek confirmation before acting.
3. Panic

The economic point of no return may come sooner than later in America. Rather, will the U.S. Gov. and Fed collaborate to pump up the economy with further stimulus checks and or/Quantitate Easing, or will Policy Makers put their feet in the sand and hold true to their proposed intentions of reducing the overwhelming fiscal/budget deficits? If our Politicians/Policy Makers have any desires to keep their respective words options number 1 and 2 will suffice, as reasonable rational responses. If option number 3 is the choice modus operandi expect obtuse action:

1. More stimulus
2. More QE
3. More government borrowing
4. More dovish talk from the Fed
5. A pop in Equities.

At present, sentiment driven trading is ubiquitous in the Global Equity Markets.
Rebuttal; "But good sir isn't equity trading more or less always sentiment driven, or all trading for that matter?"
Response: "In times like these I trust my gut instincts above all else, other traders will as well."
Rebuttal: "Why the bleak outlook, stimulus is a good thing for growth and prosperity, no?"
Response: "It depends on how long you plan on living."
Rebuttal: "I disagree, China will buy our debt forever, they need us to buy their products in order to support/sustain global growth."
Response: "Be that as it may, Japan may be the country worth worrying about. With political instability, deflation, and inconsistent budgetary reform policies simultaneously imminent, the Japanese Politicians my decide it is time to stop supporting the U.S., and sell Treasury holdings to supplant their own debt typhoon."
Rebuttal:"Don't pick on Japan. You have never been to the island, you don't know what it is like, you can't relate to Japanese culture."
Response: "I'll be in Tokyo on Monday, care to grab lunch?"

CPI data comes tomorrow morning. Good luck trading today!

Patrick M. Ambrus
Managing Partner
Analyze Capital LLC
ambrus.anlzgroup@gmail.com

Wednesday, July 14, 2010

Forex Comment: July 14, 2010

The EUR used to be leading the regional major pair's trends, but its the GBP's turn.

Seems to me relative political/economic stability seems to be the game. This can even be seen in the bond/equity markets of Germany. The same sentiments are echoed in those markets as in the Eurozone currency markets. Flight to quality.


---

Alexander Lê
Managing Parnter
Analyze Capital LLC
analyzecapital@gmail.com

U.S. Retail Sales-07.14.2010


The headline retail sales number was disappointing but there were a number of cross currents in the detail. Overall retail sales in June shrank 0.5 percent, following a 1.1 percent decline in May. The June figure posted lower than the market forecast for a 0.2 percent decline. Auto sales were a big part of the June decrease as sales ex autos only edged down 0.1 percent, following a 1.2 percent drop in May. Analysts had projected no change in sales excluding autos. Weak gasoline prices came into play also. Sales excluding autos and gasoline rebounded 0.1 percent, following a 1.0 contraction in May. The highlight of the report is a 1.1 percent boost in department store sales after a 1.7 percent drop in May.

Bloomberg.com


Patrick M. Ambrus
Analyze Capital LLC

The Golden Bubble


With the price of gold hovering around $1,200/oz, investors are wondering how much higher gold can go. In order to understand where the price will go from here, we must go back to the basics: supply and demand (note the illustration above). The supply of gold, which is mainly driven by mining, central bank sales, and scrap, has remained around 4,000 tones since 2000. Demand for gold is mainly driven by jewelry, industrial and dental uses, and investment purposes. In 2000, jewelry accounted for 80% of the demand for gold. However, in 2009 that number fell to nearly 40%. Additionally, investments in gold grew from less than 10% of demand in 2000 to over 40% of demand in 2009. Thus, with the demand for gold increasingly driven by investment purposes and the supply remaining relatively flat, we must ask ourselves, “How long do we expect investment demand to last?”

As The Economist states, “Willem Buiter, a former professor at the London School of Economics who is now the chief economist of Citigroup, has called gold the subject of ‘the longest-lasting bubble in human history’. He says that he would not invest more than a sliver of his wealth ‘into something without intrinsic value, something whose positive value is based on nothing more than a set of self-confirming beliefs.’”

On the other hand, John Paulson, the well-known New York hedge-fund manager who bet correctly on the collapse of the subprime-mortgage market, holds $3 billion-worth of gold ETFs, the largest part of his $35 billion portfolio. Also, back in February of this year, newspapers revealed that George Soros doubled his investment in gold, holding a total of 6.2 million shares of SPDR Gold Trust. This news came even after Soros stated that “The ultimate asset bubble is gold.”

According to The Economist, “As long as the world economy remains uncertain and investors fear inflation and sovereign default, gold will keep its allure. Eventually, however, the price will weaken: it is even possible that the recent slide to below $1,200 marks the turn. And investors may look back on the bull run of 2009-10—or 2009-11—with the sort of wonder that humanity has too often reserved for the yellow metal itself.”

In my opinion, gold has further upside potential. With uncertainty still remaining about the world economy, inflation, sovereign debt, and the value of currencies, investors are still looking for “safe havens” to store their money. Also, as one article that I came across states, “although gold achieved a nominal all-time high price of $1,226 per ounce in December 2009, it is still well below its 1980 price in real terms. Adjusted for inflation, the 1980 high of $873 per ounce is equivalent to over $2,200 today.” However, with this being said, we must keep a watchful eye on gold. It is possible that the recent rally in equities may be a sign that certainty is returning and that gold has met its peak.

Information cited from The Economist and other news sources.

Daniel A.
Summer Analyst
Analyze Capital LLC
analyzecapital@gmail.com

Tuesday, July 13, 2010

Joke of the Day: July 13, 2010

Italy found a good way for a country to solve some of their fiscal problems!

Italy nabs 300 mobsters, reveals new mob structure

And I quote: "the seizure of more than euro60 million ($76 million) in cash and property."

I'm sure they can get more when the liquidate everything and if they can squeeze more mobsters for $$.


Well lets see the Piigs:

Spain and Portugal - ETA
Ireland - Irish Mob
Greece - Greek Mob

Yep, lots of money to be "made," my old professors loved harpin on the "billions" of dollars of black market economy contributing to world GDP.


---


Alexander Lê
Managing Partner
Analyze Capital LLC
analyzecapital@gmail.com

Jesse Livermore/Natural Gas Update- 07.13.2010


And the Magic number is? $4.35. If we see a clean break below this level I expect NG to test the next levels of support at $4.15. Volume confirmation is key. Prices have traded in a narrow range the past four days due to "forecasts of moderate temperatures in the U.S. Midwest and Northeast later this month," according to commodityonline.com.

On a positive note, the 50 day SMA looks to be converging with the 100 day SMA. Couple this with strong Supply and Demand Data and we should see a clean retest of $4.50. I will be looking for a decrease in supplies, in-ine or below estimates. Until then I will sit, wait, and hope I do not get stopped out.

"There is only one way to achieve success in speculation--through hard work, persistently hard work. If there is any easy money lying around, no one is going to try and give it to me, this I know."

--Jesse Livermore, World's Greatest Stock Trader

Monday, July 12, 2010

Nat Gas Update


Unfortunately, my position was stuck in the mud all day. NG contracts for August delivery reached a high, mid-morning EST, of close to $4.445/mmBtus. I entered at $4.45. Tonight I will watch GLOBEX trading and re-evaluate my position before NYMEX trading opens tomorrow morning. Currently prices are hovering around $4.388.

To hold it upright and fill it, is not so good as stopping in time. When you pound it out and give it a point, It won't be preserved very long. When gold and jade fill your rooms, you'll never be able to protect them. Arrogance and pride with their wealth and rank, on their way bring disaster. When the deed is accomplished you retire; Such is Heaven's way.

--Lao-Tzu, Chapter 91


Patrick M. Ambrus
Analyze Capital LLC

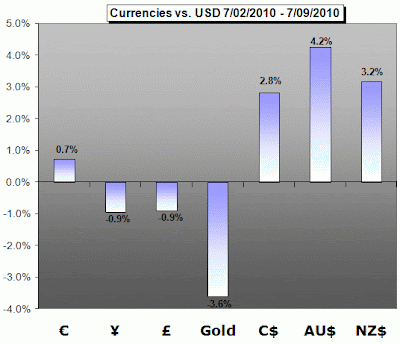
Last Weeks Currency Moves: 07/02/10 - 07/09/10

Taken from DailyFX.com

Thursday, July 8, 2010

Britain's Budgetary Blues


The financial crisis of 2008 has left the British Government this year with a fiscal deficit of 11% of GDP. To combat the growing deficit that is crippling the British economy, George Osborne, the newly elected Conservative Chancellor of the Exchequer, presented a new austere budget called an “emergency package” aimed to reduce government spending by 6.3% of GDP by 2014-15. Three quarters of the projected budget cuts will come from spending in many of the governments departments, including welfare. The rest will come from tax hikes, including a rise from 17.5% to 20% in the consumption (VAT) tax rate starting January 2011, which is expected to raise £12.1 billion or 0.8% of GDP next year.

In an attempt to prevent more businesses from leaving the British market, Osborne has planned to reduce the corporation tax from 28% gradually to 24% by 2014. The chancellor is also expected to keep many of the tax increases proposed by the previous labor government of Gordon Brown, however Osborne plans to mitigate the rise in national insurance contributions next April by raising the tax-free NIC allowances of employers. All of these measures will in no doubt ease the deficit crisis Britain is currently facing, however, whether all the proposed budgetary cuts are realistically possible remains unclear.

One of the biggest concerns revolves around the Government’s refusal to implement any cuts on the very popular National Health Service. The program absorbs over 25% of government spending alone, and has grown faster this past decade than any other program. Because of the political pressure to keep the system intact, other government departments will have to suffer enormous cuts, in some cases averaging up to 25% by 2014-15, which will be politically problematic as divisions between the Tories and Liberal Democrats may become exposed. Some critics believe there was a missed chance to redesign the tax system in order to incorporate a carbon tax that could be used to fund infrastructure construction. Others believe more emphasis needs to be put on the implemented methods of delivery government services have rather than the programs themselves. Nevertheless, Osborne’s proposals amount to £113 billion in government spending cuts by 2014-15, £40 billion more than his predecessor projected.

Chancellor Osborne and the British cabinet clearly believe that by lowering the debt burden to reduce or eliminate future cuts in services and welfare, the British economy will grow. Smaller government will allow businesses to invest more freely, stimulating exports, expanding the economy and lowering unemployment. Even so, that excess capacity could limit business investment. Restraining spending and higher taxes could also complicate the domestic markets ability rebound from the recession. The OBR, an independent think tank, believes the British economy will slow down to 2.3% rather than the projected 2.6% in 2011. Whether the new measures are realistic or not remains to be seen, what is certain is the Chancellor Osborne needs to produce some results while remaining flexible and cautionary during these volatile times. As the Economist notes, “Osborne has proven courage, but wisdom dictates that he better have a plan B”.

Information cited from the Economist Magazine, Website and other news Sources.

Tom Rodelli
Research Analyst
Analyze Capital LLC
trrodelli@gmail.com

Nat Gas Inventories/Trade


Natural gas in storage rose 78 billion cubic feet in the latest week. An injection of 70 bcf was expected.

Bloomberg.com


As one can see from the chart, I purchased some August NG contracts on the the oversupply news. My stops are set around 4.35. Though, I expect to ride this trade out over the next day and half. My price target is $4.53/MMBtu. I will keep you updated on any new developments.

Patrick M. Ambrus
Analyze Capital LLC
analyzecapital@gmail.com

Wednesday, July 7, 2010

Oil Update- 07.08.2010


Yesterday afternoon I bought some CL futures at a price of $72.60/barrel. My call has paid off thus far as crude is floating to $75/barrel. I will take some profits in the morning and re-evaluate from there. I may wait to see the EIA data before I make my trades for the rest of the week. Stay tuned!

Related ETFs: PowerShares DB Crude Oil Short ETN (SZO:US), United States 12 Month Oil Fund LP (USL:US), PowerShares DB Crude Oil Double Short ETN (DTO:US)

Patrick M. Ambrus
Analyze Capital LLC
AnalyzeCapital@gmail.com

Euro Zone GDP Revision-07.07.2010


Euro area1 (EA16) and EU271 GDP both increased by 0.2% during the first quarter of 2010, compared with the previous quarter, according to second estimates from Eurostat, the statistical office of the European Union. In the fourth quarter of 2009, growth rates were +0.1% in the euro area and +0.2% in the EU27.

In comparison with the same quarter of the previous year, seasonally adjusted GDP rose in the first quarter of 2010 by 0.6% in the euro area and by 0.5% in the EU27, after -2.1% and -2.3% respectively in the previous quarter. In the first quarter of 2010, among Member States for which seasonally adjusted GDP data are available, Ireland (+2.7%) recorded the highest growth rate compared with the previous quarter, followed by Sweden (+1.4%) and Portugal (+1.1%).

EuroStat


Always happy to see an upward revision in GDP numbers for the EA 16. What does this data mean other than confirming that statisticians cannot make precise calculations? Nothing. The current problems of growth, liquidity, & solvency in the EA 16 will reveal themselves to us at an unexpected time, with robust data/rumors.

It looks like Dwayne Wade and Chris Bosh will team up in Miami according to ESPN's Chris Broussard. All the more reason for The King to play in the greatest city in the world, NYC!

Related ETFs: iShares MSCI Spain Index Fund (EWP:US), SPDR EURO STOXX 50 ETF (FEZ:US), iShares MSCI EMU Index Fund (EZU:US)


Patrick M. Ambrus
Analyze Capital LLC
Managing Partner
ambrus.anlzgroup@gmail.com

Tuesday, July 6, 2010

Crude Trade Pays


Last Thursday I posted that if crude dipped to about 72.50 it would signal a buying opportunity. If one bought at this juncture or entered a bit lower, there was a nice profit waiting for the trader this morning. From my previous post:"I will stay cautious and watch the tape closely on this. If I see $72.50-73.00 buying may be a viable option."

WTI Light Sweet is off about $0.27/b sitting @ $72.33/barrel. If there is a dip before closing today I will jump back in and look to stay long up until $74.00.

Related ETF's: Goldman Sachs Crude Oil Total Return ETN (OIL), United States Short Oil Fund (DNO), ProShares Ultra DJ-AIG Crude Oil ETF (UCO)

Patrick M. Ambrus
Managing Partner
Analyze Capital LLC
Twitter: AnalyzeCapital

Monday, July 5, 2010

Stimulus Package Tank Reading Empty?


June 24th marked the end of Barack Obama’s economic stimulus package of $700 plus billion. With a weakening economy and an evident global economic downturn, this reality may spell bad news for many large organizations and states that benefited from the stimulus provided by Washington. Presently, the Obama administration is lobbying to inject another $266 billion of stimulus measures to stabilize and counter any possible deflationary pressures that could plague the US economy in the near future, however significant opposition within the federal government and from abroad stand against any possible measure.

The sovereign debt crisis in Europe has demonstrated the political price of any new borrowing to not only their respective governments but also in the United States and its major economic global partners. The recent “American jobs and Closing Tax Loopholes Act” presented by democratic leaders that contained $79 billion for unemployment benefits, health insurance subsidies for the unemployed, and state grants for Medicaid, reflects the negative sentiment of any new spending. The strong republican opposition limited the eventual sum of the bill to $34 billion for fear of the deficit spiraling out of control. And, with the recent primaries indicating strong voter antipathy, especially among republicans, for any increases in spending, deficits, or taxes there appears to be little room for any new measures to be passed this year.

Without any new stimulus the budgets of many American states will suffer dramatic economic deficits and probable budget cuts. California is one example where already appalling education standards, due to a lack of appropriate funding, are set to be cut even further as funding per pupil has dropped over 11% in the state, and that was with the aid of the stimulus program. Michigan is another example where since the collapse of the automakers unemployment has risen to a staggering 30%. Without the continuation of government aid and stimulus there appears to be little hope for the state to fund and promote the creation of new jobs and industries to revitalize their depressed economy.

Virtually every industry has shed jobs during the last 2 years and now that the stimulus money has run out there is a strong sentiment among economists that the American and Global Economy could plunge once again into another full recession, unfortunately proving those double-dip recession advocates correct. Regardless of whether a new stimulus package is passed or not, what remains clear is that something needs to be done to continue aiding state economies revive themselves and prevent more jobs from being lost. Whether it is the federal government injecting more liquidity into the system or creating new tax incentives to help fledging businesses stay profitable and not cut jobs, Barack Obama has many economic questions to ask and more to answer, and on-top of 2 wars and a disaster in the gulf, there seems little room for failure.

Information cited from the Economist Magazine and website.


Tom Rodelli
Research Analyst
Analyze Capital LLC
e-mail: trrodelli@gmail.com

Market Update- 07.05.2010


Equity Indicies

Europe
ESTX 50 € Pr 2,516.09 -6.27 (-0.25%)
FTSE 100 INDEX 4,839.44 1.35 (+0.03%)
CAC 40 INDEX 3,340.48 -7.89 (-0.24%)
DAX INDEX 5,830.93 -3.22 (-0.06%)
IBEX 35 INDEX 9,317.40 66.60 (+0.72%)

Asia
NIKKEI 225 9,266.78 63.07 (+0.69%)
HANG SENG INDEX 19,842.20 -63.12 (-0.32%)
S&P/ASX 200 INDEX 4,222.10 -16.60 (-0.39%)

Commodities

Energy
BRENT CRUDE FUTR (USD/bbl.) $71.570 -0.080 (-0.11%)
WTI CRUDE FUTURE (USD/bbl.) $71.880 -0.260 (-0.36%)
GAS OIL FUT (ICE) (USD/MT) $614.750 -0.750 (-0.12%)
NATURAL GAS FUTR (USD/MMBtu) $4.798 0.111 (+2.37%)

Metals
GOLD 100 OZ FUTR (USD/t oz.) 1207.700 0.000 (+0.00%)
SILVER FUTURE (USD/t oz.) 17.780 0.061 (+0.34%)

Debt
UST 10Y Price: 104.47 Change:+0.03 Yield: 2.97 Change: +/- 0.00
GBund 10Y Price: 103.94 Change: +0.32 Yield:2.54 Change: -0.04
Gilt 10Y Price: 111.71 Change: +0.27 Yield:3.32 Change: -0.03
JGB 10Y Price: 101.66 Change: -0.20 Yield: 1.12 Change: +0.01

Foreign Exchange
EUR-USD 1.2518
GBP-USD 1.5093
USD-JPY 87.7510
EUR-JPY 109.873
AUD-USD 0.8389
USD-CAD 1.0662
USD-CHF 1.0673
USD-HUF 228.0350

Today I won't be trading. I am taking this Independence Day Holiday break to catch up on some work and clear my head for the rest of the week. Last week I closed out my long USD-CAD position and scored about 200 pips. Also, I managed to close out my short Nat Gas position unscathed with some decent profits.

NBA free agency began on Thursday July 1st. It already looks as if we have Amare Stoudemire wrapped up in 5 Year/$100 MM contract. Please Basketball gods, deliver LeBron to The Knicks.

Enjoy the beach!

Related ETFs: iShares MSCI Emerging Markets Index Fund/United States (EEM:US), Vanguard Emerging Markets ETF (VWO:US), Direxion Daily Emerging Markets Bull 3X Shares (EDC:US)

Patrick M. Ambrus
Managing Partner
Analyze Capital LLC
ambrus.anlzgroup@gmail.com

Friday, July 2, 2010

Technical Analysis: SPX


Technical Analysis Summary:
-The SPX recently broke the neckline of a head and shoulder pattern
-This indicates that the stock could potentially go down the same length as the distance between the neckline to the head
-Therefore, if the SPX follows a head and shoulder reversal pattern, the price target should be between 900-925 for about the next two months
-The SPX is currently below both the 50-day MA and 200-day MA
-Furthermore, the 50-day MA is on the brink of crossing the 200-day MA, which provides further evidence that the SPX is heading down (note: the 50 MA has stayed above the 200 MA since the end of June 2009, so this crossing is significant)
-I would wait a day or two to see how the trend plays out. If the SPX does not make gains, then I would enter a short position.
-One way to hold a short position on the SPX is to hold the ProShares UltraPro Short S&P 500 ETF (SPXU)
-This ETF is triple leveraged, which could be useful if the SPX does not decline as much as the head and shoulders reversal pattern indicates
-Low put/call ratios in the past month for this ETF hint that investors are expecting it to rise

ProShares UltraPro Short S&P 500 ETF (NYSE: SPXU):

As of 7/1/10:
Current Price: 39.68
52 week range: 26.27 – 86.01
Average volume: 7.77M
Market cap: 333.31M
Shares: 8.4M

June 30: 328 put and 1,022 call contracts à 0.32 put/call ratio
June 29: 412 put & 1,281 call à 0.32 put/call ratio
June 4: 106 put & 1,266 call à .08 put/call ratio

Conclusion:
From a purely technical standpoint, the SPX looks like it is positioned for a decline. To be on the safe side, I would wait 1-2 days to see how the market plays out. If the SPX cannot produce gains within the upcoming days, then I would enter a short position. Ideally, I would hold the short position for about two months. However, with uncertain economic conditions, I would monitor my position from day to day and be ready to exit it if conditions are not working in my favor.

Daniel A.
Summer Analyst
Analyze Capital LLC

Crude and Gold Brief - July 2, 2010

PREVIOUS OIL/GOLD TECHNICAL UPDATE

The Fundmental Analytics - by Pat Ambrus


________________________________________________________


My mistake for crude this week:

I drew something like this in my past post (minus the extra time frames).


When in reality the channels would have been more appropriately defined on a longer time frame such as this:


The lesson being expanding your time frame is key for getting correct technical analysis. I was initially correct on on the downward momentum, but completely wrong on the 75 support. Which would have meant exiting early, and would have cost missed profits.

The real test of support is seen in the longer time frame, as shown above, at 70. This makes for a much wider range of support/resistance at 70 and 80 respectively, seen back from the previous summer 2009.


Ill re-iterate the long term picture:


Price pressure has broken to the downside. The test of 70 Support is "KEY" to see whether or not we will see prices in free fall.


Putting this in a relational context:

VS. EUR


To me this graph tells me that the EUR is not a good proxy for the overall dollar in this current environment. The purple line being the EUR trend. To the left of the vertical line we see EUR weakness (dollar strength) with strong CL and to the right we are starting to see EUR strength (dollar weakness) with CL weakness. The traditional dollar/CL correlation maybe biased with economic differences when using a dollar index to compare to CL (depending on the construct and weighting of a dollar basket). Simply put, we are not seeing the typical correlation between the dollar and CL.

However in the same given time period we are seeing very high positive correlations between the SPX and Crude:

(purple line is the SPX)

As I have analyzed the SPX Here; of which I continue to be bearish on.

If my correlation analysis is correct, which I will assume is, I am also bearish on CL. This means 1000ish SPX support coincides with 70 CL support. Both these levels should be watched closely.


SUMMARY:

I am bearish on CL for next week.


PS: My call on gold has been correct to date so far...

----

Alexander Lê
Managing Partner
Analyze Capital LLC
analyzecapital@gmail.com

SPX update: July 1, 2010


Well I do declare….

Well besides that "The Office" is now dead…


I do declare victory! Prices today the SPX touched low 1000's. MACD arguably has downward momentum as long as RSI can go undersold for a week or so. However, the ONLY time in the past 3 years that we have seen RSI stay below 30 RSI (undersold territory) was throughout the 08 crises. Which bodes well for the bullish people who believe support may hold at 1000.

However the bearish evidence continues to mount. 200 convergence above 50 SMA is sure to come with further moves to the downside. However, I wouldn't be surprised to see short covering tomorrow as support approaches. Into next week though, with the cross of SMA's we may even see break into 1000 support, and MACD certainly shows that downward momentum has plenty of room to fall, as zero balance has hit far below 0 during 2008.

If my previous Head and Shoulders analysis is indeed correct prices should correct to 950.

Whether or not this will happen… I will have to get back to you on this as this requires more analysis. I will watch how friday plays out into monday.

For today, I'll celebrate this little win … and continue to cry over my forex position I'm still managing… but more on that later.


**Check my performance from my previous Post's; tell me if I wasn't clear or If I have flip flopped, from what I gather though I have been rather clear. "Previous Post Here"<----**


----

Alexander Lê
Managing Partner
Analyze Capital LLC
analyzecapital@gmail.com

Thursday, July 1, 2010

Crude Oil Inventories


A drop in imports made for a 2.0 million barrel draw in oil stocks for the June 25 week. Imports fell to an in-trend 9.5 million barrels per day, down from last week's 2010 high of 10.1 million. Refineries increased output, feeding a 0.5 million barrel build for gasoline stocks and a 2.5 million build for distillates.

Gasoline demand is a plus for the report, at a year-to-date best of 9.3 million barrels per day for a plus 1.5 percent year-on-year rate. Distillate demand softened slightly to 3.8 million barrels but continues to show a strong year-on-year rate of 10.9 percent that reflects industrial activity

Bloomberg.com


Oil is selling off in early Globex trading. I did not see WTI touching $74/b again until a new high of $83/b:

Reasons for pull-back:

1. Supply issues in Kushing, Oklahoma still remain a large concern.
2. Couple this with bad economic data and/or fear of stagnant global growth
3. Strong Dollar vs. Loonie, Aussie, and Sterling


I will stay cautious and watch the tape closely on this. If I see $72.50-73.00 buying may be a viable option.

Related ETFs: iShares S&P GSCI Commodity Indexed Trust (GSG:US), PowerShares DB Oil Fund (DBO:US), United States 12 Month Oil Fund LP (USL:US)

Patrick M. Ambrus
Managing Partner
Analyze Capital LLC
Twitter: Analyze Capital
 
Disclaimer
This Blog has been developed by Analyze Capital LLC, and as an independent organization we provide “AS IS” information without warranty. The ideas and opinions expressed by the contributers of this blog are personal and do not represent the actions or policies of Analyze Capital LLC. The contents of this blog do not intend to assert recommendations or to offer advice of any kind. We are not responsible the consequences, be they gains or losses, that may result from using any of the information from this blog.