rss
email
twitter
facebook
Showing posts with label Commodities. Show all posts

Tuesday, November 9, 2010

The Tower of Terror: Going Down?


Today was a wild ride. We hope most of you who were long as of this morning either own protection or had stop loss orders in place. Most asset classes tanked on the heels of a poor 10 Year Treasury Note auction at 13:00 EST. The Dollar strengthened as U.S. equities bled and Oil dipped below $85.60/barrel. On a positive note, The Ag trade remained resilient thanks to bullish data from the USDA report this morning. In particular, Raw Sugar was up almost 4% and closed at $0.3311. Yet, out of all this unexplainable excitement today's zippy price action in Gold piques our curiosity the most.

Gold traded up to new all-time highs of nearly $1425 per Troy ounce before its precipitous sell-off to $1385. Wow, a $40 range in one session! Surely, we will not take this abrupt volatility lightly. Or shall we?

December Nymex GC

Even though GC sold off materially after its morning erect, none of us should gasp in awe. Gold is everywhere. The likes of ESPN, NBC, and even NBA TV (yes) bombard us with daily commercials pedaling the 'once in a life-time opportunity' to own the not so rare/often ignored physical form of the precious metal. In addition, we watch in silence as the members of the far right such as Glen Beck hypnotize our fellow men into believing that bullion is the only asset capable of protecting us from the imminent economic collapse (Rubbish we say, moldy rubbish). Also, Gold frequently claims the front-page headlines of local, national, and international information (what really qualifies as news these days?) periodicals. In short, Gold is ubiquitous.

Regardless of Gold's correlation/pricing with/in the U.S. Dollar the precious metal has now become a speculative trading vehicle rather than an inflation/deflation/sovereign debt/economic collapse/financial armageddon hedge. Don't believe us? Let us briefly examine the SPDR Gold Shares (GLD) ETF. In the period between October 1 - November 8 on average 17.75 million shares of GLD changed hands daily. In the prior 27 trading days average volume came in at only 12.1 million shares daily. With the aid of an envelope, we calculate this increase in volume to be nearly 47%! Also, as of GLD's Q2 SEC filing approximately 96 million new shares were created. This brings the total shares outstanding to a whopping 434 million. Hence, more retail investors joined the game.

Where do prices go from here? Up, Up, and away. The Federal Reserve's quantitative easing program will most likely impede any progress the dollar makes, and thus openly encourage irresponsible commodity speculation. Also, do not let us discount emerging market demand stemming from a desire to diversify reserves away from U.S. Treasuries (yes we point to China). Finally, we will be wise and remember that a bubble only becomes a bubble once the masses are aware. This point is of critical importance to remember while prices sail to uncharted territory.

-Patrick M. Ambrus

Sources: bloomberg.com, finance.yahoo.com, spdrgoldshares.com, USDA.gov

Disclosure: No Positions


Tuesday, October 19, 2010

Hurricane China Watch


22:40- Commodity Update

WTI CL- November ‘Crude oil rose, recouping part of the biggest loss in eight months, as China’s interest rate increase added to signs of economic growth and analysts forecast a decline in U.S. fuel stockpiles. Futures gained as much as 0.4 percent after dropping 4.3 percent yesterday, the biggest decline since Feb. 4.’

November Crude trades at $79.90/b up $0.30. December Crude trades at $80.50/b up .37%. Globex shows December contract volume of 4.8k. Due to impending expiration on Wednesday, November crude only traded 481 contracts as of writing.

‘The Energy Department report today may show U.S. gasoline inventories fell 1.5 million barrels, according to the median of 16 analyst estimates in the Bloomberg News survey.’ (Bloomberg.com)

Natural Gas- NG contracts expiring on October 27 continue to pick up traction from yesterday’s session in which prices rallied more than 2%. The front month contract is up by .51% to 3.538.

GC- Gold was crushed in yesterday’s session and traded down by $40 on December contracts. The precious metal is up by $3.50 to 1337.10/Toz.

Copper- After trading down to 3.7250 throughout the NYMEX session, HG gained some traction during Globex trading. The Red base metal December contract is up by .94% to 3.7655.

22:30- FX Commentary

EUR/USD- The Euro has weakened a bit since the blood bath, across all asset classes, at the close of NY trading. The pair traded as low as 1.3700 @ 20:00. The slight breach of 1.37 triggered heavy buying up to 1.3750. Since then the pair has bounced and now trades higher by 58 pips from the lows to 1.3758. The pair is up 34 pips on the session.


USD/CHF- The ‘Swissy’ traded down to .9680 at 21:50 from session highs of .97185 at 20:00.  The pair is weaker by 32.5 pips on the session and was last quoted at .9686.
AUD/USD- Watching this pair is almost as much fun if not more fun than the viewing the  EUR/USD trade.  The Aussie dropped to .9665 at 20:00 and paired all losses to touch a session high of.9742 at 21:45.  The pair now trades at .97375.


Trading Economics
Many Commodity traders who held Net long positions may have been caught off-guard when The People's Bank of China explicitly announced hawkish monetary policy in order to curb inflation:
"China's benchmark rates are not an overnight lending rate as is the case in the United States and other major western economies. Instead, it has a one-year interest rate on saving deposits, which increased to 2.5% and a one-year interest rate on loans, which rose to 5.56%." (CNNMoney.com)


GDP, CPI, PPI, Retail Sales, and Industrial Production data are to be released tomorrow evening.  Economists expect the Chinese economy grew by 9.5% yoy in the third quarter of 2010.  Any growth figures over 10% ought to unleash the commodity bulls from the proverbial cage they were placed in today.

-Patrick M. Ambrus

Sources: Bloomberg.com, Economy.com, listown.com, CNNMoney.com

Friday, October 15, 2010

Early Bird Update


00:016- Equity Commentary

The Nikkei 225 is off .52% to 9530. Bloomberg attributes the drop to Investor Sentiment:

‘“Investor sentiment is a bit twitchy,” said Shane Oliver, Sydney-based head of investment strategy at AMP Capital Investors Ltd., which manages $85 billion. “The U.S. data was a bit poor. This week we’ve had a couple of good days and investors may be looking to take profits.”

The CSI is up 2.00% or 65 points to 3,288.52. The ASX 200 is down 13 points to 4686.60.

In the U.S. GE reports before the opening bell on the NYSE: “Analysts project a second straight quarter of higher profit after eight periods in which it declined or was little changed. Adjusted earnings may be 27 cents a share on sales of $37.4 billion, the average of estimates in a Bloomberg survey.”


SPX, Dow, and Nasdaq Futures are flat. 5 and 10 Year Treasury futures are up 0.05% as of writing.

00:05- Commodity Commentary

Energy- Nat Gas is currently positive by $0.0001, up on light volume. November CL contracts have followed the dollar for most of the session. Losses were paired from 82.53. November contracts are up at $82.75/barell.

Precious Metals- Silver has led the rally and is up 1.47% or $0.36 to 24.795. I see $25.00 on Silver before $1400 on Gold. Gold is positive on the session up $3.60 to 1381.30.


Grains- Wheat and Corn continue to rally as we have a global shortage. In addition corn may be benefiting from E15 legislation now in place. Though, bullish activity is in order until the next USDA report reports accurate Supply numbers. The always important yield/acreage ratios remain on the low side when measured against previous estimates. Wheat is up .82% and Corn is up .93% on the session. Additionally, Soybeans continue to extend gains, advancing by 1.20%.

00:00- FX Comentary

EUR/USD- the pair traded down as low as 1.4009 at 20:15. The pair then traded up to 1.4049 and faced resistance at 1.4050. The 'Sovereign Default Trade' seems to have found support in the 1.4025-1.4035 range. Currently we are long at 1.40387.


Cable trade - The pound traded down to 1.5985 at 20:30 and has since traded up around 1.6005. The pair sits at 1.5997 at present time.


U.S. Dollar Index- The DXY gained traction and is trading up to 76.88.

U. S. Trading

CPI , Empire State, and Retail Sales come in at 08:30.  I expect 'robust' retail sales data to bolster equities.  Additionally,  expect a weaker USD tomorrow with stronger Commodities.  Good morning and good luck.

-Patrick M. Ambrus

Sources: Bloomberg.com, Stockcharts.com, The Gartman Letter, Financial Times

Thursday, September 23, 2010

Buoyant Natural Gas


EIA Data release for week ending September 17, 2010:


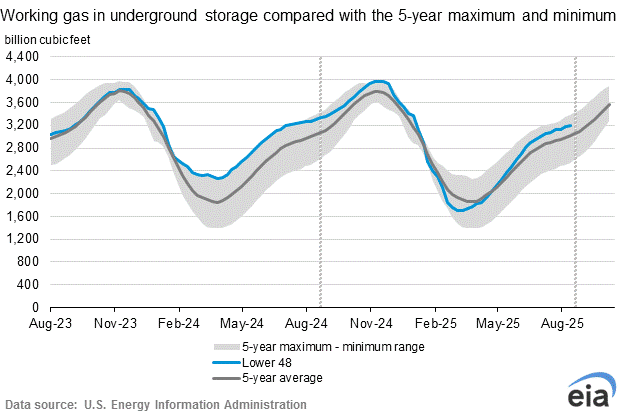
Working gas in storage was 3,340 Bcf as of Friday, September 17, 2010, according to EIA estimates. This represents a net increase of 73 Bcf from the previous week. Stocks were 175 Bcf less than last year at this time and 195 Bcf above the 5-year average of 3,145 Bcf. In the East Region, stocks were 16 Bcf above the 5-year average following net injections of 53 Bcf. Stocks in the Producing Region were 114 Bcf above the 5-year average of 915 Bcf after a net injection of 19 Bcf. Stocks in the West Region were 65 Bcf above the 5-year average after a net addition of 1 Bcf. At 3,340 Bcf, total working gas is within the 5-year historical range.


Price Data


Headwinds

A significant portion in achieving upward price momentum has been unpredictably moderate temperatures. We are in an environment in which Nat Gas is not needed for cooling nor for heating. Additionally, Hurricane season has yet to come to fruition (that is an oxymoron but rings some truth for an energy trader) and will likely continue upon its uneventful season. However, hope remains in the form of tropical storm Lisa. WIth warmer temperatures in the Atlantic, the potential for greater velocity of headwinds and illustrious destruction increases rapidly; think Hurricane Rita. If the storm hits the North East, I would look for Philadelphia output to stagnate.

Tailwinds

We'd like to see the November contracts find support at $4.15/mmBtu. Though the contangion spread between November/December contracts (.216) is much wider than that of December/January (.1620). A scenario could develop in which the November/December spread widens until demand firms for the near-month contracts. Otherwise, spreads should narrow as the near month November contracts gain demand traction. We expect to see sustainable support of $3.98 on October contracts expiring on Tuesday.

December NG: 3-Month Daily Chart


Trade

As Alex astutely alluded to yesterday, we are long MINY December Contracts. We will look to'pyramid' once prices move into a tighter range at higher price levels, if there is such a thing.

Patrick M. Ambrus
Twitter: AnalyzeCapital

Source: http://ir.eia.gov/ngs/ngs.html

Monday, September 20, 2010

Do Your Own Homework-SPX Update


'Buying Gold is an excuse for people not to do their homework.'

-Alex

SPX: 1 Year Daily Chart:


Another day another dollar: that is true if you were long the SPX in U.S. trading today. The SPX rallied 1.45% to 1141.92 on the session led by Energy, Consumer Discretionary, and Industrial stocks. Many Tech bellwethers displayed robust performances as Google rallied 3.7% to 508 and AAPL closed above 280 up 2.85%.

Pop Quiz: Why did equities rally today class?


a. President Obama's Town Hall assured investors America is "The Greatest Nation"
b. The SPX broke resistance of 1131
c. Japanese Markets were closed
d. The Tea-Party will uproot American Politics
e. No significant economic data released
f. I forgot how to take these tests

The answer is probably a combination of b, c, and e. The S&P finally broke out of its uninspiring trading range on light volume. Though, this may be short lived. Early in the session gold rallied to new highs around 1284. However, these gains were unsustainable. In addition, agricultural commodities, base metals, and Natural Gas led commodities lower. The USD failed to sustain any gains against the Euro, Sterling, 'Aussie', and CHF. Also, the bond market lacked bullish convictions. Alas, capital flowed into equities by default.

October Nat Gas:1 Month Chart


December SPX E-mini: 1 Month Chart


Trades
We took advantage of the sharp sell-off in December Nat Gas contracts and entered a long position as prices firmed. Also, we are long the Dollar vs. CHF. U.S. Housing Starts come in at 08:30 and The Fed decision is at 14:15 EST. We expect equities to pair some of their gains in tomorrow's session.


Patrick M. Ambrus
Twitter: AnalyzeCapital

Sources: Stockcharts.com, Bloomberg.com, VanityFair

Thursday, September 9, 2010

Black Gold


But eventually it's a question of access: Getting access to fields is on top of the oil companies' agenda. We see a substantial build-up of supply occurring over the coming years.

-Daniel Yergin


WTI Crude Oil traded higher up to $75.95/barrel during the morning session. However the commodity pulled back when the EIA data was released. The October contract currently trades at $74.10 Below, I compiled some of the key EIA data for your own synthesis & analysis.


Price Pressure
Why has CL1 traded in a range for the past month? There is a large contagion gap between the near month October Futures contracts and the November Contracts of 2.04%. As settlement date approaches, November prices will fall. In addition, supply levels in Kuching Oklahoma remain above historical levels for this time of year.

Macro View
Growth numbers out of China have been less than stellar. China PMI data was up only .5% from July to 51.7%, HSBC numbers were below 50. Also, the 'Deflation Story' in the U.S. and Japan will not help the perception of commodities. As money continues to flow into the bond market inflationary investments become less attractive. Lastly, there has been less conflict in the Middle East than normal. Thus, OPEC sour-crude supply is not in danger of shortages in the near-term.

Highlights from EIA Report


-U.S. crude oil imports averaged 8.9 million barrels per day last week, down by 794 thousand barrels per day from the previous week.
-Over the last four weeks, crude oil imports have averaged 9.5 million barrels per day, 500 thousand barrels per day above the same four-week period last year.
-U.S. commercial crude oil inventories (excluding those in the Strategic Petroleum Reserve) decreased by 1.9 million barrels from the previous week.
-At 359.9 million barrels, U.S. crude oil inventories are above the upper limit of the average range for this time of year
-Distillate fuel inventories decreased by 0.4 million barrels, and are above the upper boundary of the average range for this time of year.
-Total products supplied over the last four-week period has averaged 19.6 million barrels per day, up by 0.7 percent compared to the similar period last year
-Jet fuel demand is 0.8 percent lower over the last four weeks compared to the same four- week period last year.
-During June and July of 2010, the Gulf oil producing region was impacted by two storms: Alex and Bonnie shut in a cumulative total of about 1.6 million barrels of crude oil production.


Patrick M. Ambrus
Twitter: AnalyzeCapital

Empirical data is courtesy of eia.gov

Thursday, August 26, 2010

Nat Gas Inventories/Trade


Working gas in storage was 3,052 Bcf as of Friday, August 20, 2010, according to EIA estimates. This represents a net increase of 40 Bcf from the previous week. Stocks were 198 Bcf less than last year at this time and 177 Bcf above the 5-year average of 2,875 Bcf. In the East Region, stocks were 15 Bcf above the 5-year average following net injections of 48 Bcf. Stocks in the Producing Region were 84 Bcf above the 5-year average of 865 Bcf after a net withdrawal of 5 Bcf. Stocks in the West Region were 78 Bcf above the 5-year average after a net drawdown of 3 Bcf. At 3,052 Bcf, total working gas is within the 5-year historical range.

ir.eia.gov


This morning I entered a long position in some QG futures. I believe we will see prices move up to 4.00-4.10 before the next pullback. The RSI on the the NG futures remains in oversold territory, and momentum is bottoming. In addition, The UNG confirms a similar trading trend in the RSI and MACD. Also, I expect the 20 day SMA to cross the 50 day. Prices are already bouncing back from the inventory data release.

Patrick M. Ambrus
Analyze Capital LLC
Twitter: Analyze Capital

Wednesday, August 25, 2010

Crude Oil Inventories & Commentary


Oil is falling sharply in reaction to large builds in weekly inventory data. Oil stocks rose 4.1 million barrels with gasoline stocks up 2.3 million and distillates up 1.8 million. The data are for the August 20 week.

Gasoline demand slowed to a 3.0 percent year-on-year pace vs. 3.5 percent and 3.3 percent in the prior weeks. Distillate demand has been slowing abruptly for nearly two months, now at plus 4.9 percent year-on-year. Supply has been heavy the past year but signs of trouble on the demand side may now begin to shift the picture for oil which has been narrowly rangebound all summer.

Bloomberg.com


Has Crude finally found a bottom to this downtrend? It is hard to say. To quote Alex, " 50/50 chance crude ticks up." I do concur. Supply levels of NYMEX WTI are out of control. However, as long as emerging markets demand remains robust, crude should not fall below $65/b. I need to see price movement above the $75-76 line before I turn bullish once again. For now the tape is range bound. Until supply witless down and the EUR/USD pops, I expect crude to trade between $70.50 -$74.

In case anyone was wondering, I was stopped out of My USO calls. Extremely poor trade on my behalf. At least I learned a valuable lesson. Don't buy calls without protection. I will be trading futures for the foreseeable future.

Related ETFs: PowerShares DB Crude Oil Dble Long ETN (DXO), UltraShort Oil & Gas ProShares (DUG), iPath S&P GSCI Crude Oil Ttl Ret Idx ETN (OIL)

Sports: Team USA smacked Greece 87-59. Eric Gordon led the way with 18 points, 4-7 from the promise land.

Patrick M. Ambrus
Analyze Capital LLC
Twitter: Analyze Capital

Tuesday, August 10, 2010

FOMC Decision


Information received since the Federal Open Market Committee met in June indicates that the pace of recovery in output and employment has slowed in recent months. Household spending is increasing gradually, but remains constrained by high unemployment, modest income growth, lower housing wealth, and tight credit. Business spending on equipment and software is rising; however, investment in nonresidential structures continues to be weak and employers remain reluctant to add to payrolls. Housing starts remain at a depressed level. Bank lending has continued to contract. Nonetheless, the Committee anticipates a gradual return to higher levels of resource utilization in a context of price stability, although the pace of economic recovery is likely to be more modest in the near term than had been anticipated.

To help support the economic recovery in a context of price stability, the Committee will keep constant the Federal Reserve's holdings of securities at their current level by reinvesting principal payments from agency debt and agency mortgage-backed securities in longer-term Treasury securities. The Committee will continue to roll over the Federal Reserve's holdings of Treasury securities as they mature

federalreserve.gov


Thomas M. Hoening was again the lone FOMC dissenter. Since Helicopter Ben uttered the phrase 'nascent recovery' on Capital Hill, cryptic language has proceeded. Clarity from the FED going into the 4th quarter is unquestionably salient. Perhaps, we (market participants) should sit tight until Jackson Hole concludes. Surely, transparency will become abundantly apparent after the curtains close at the Committee's annual Wyoming refuge.

Uncertainty is apparent in risk/reward security markets. At this point in time, The FED maintains relevance and reverence on the Streets plastered with Investment Banks rather than cafe's and bakeries. Ergo, Monetary Policy must remain stable as U.S. fiscal policy shifts political party lines. The Bush tax cuts abide while politicians play musical chairs.

Something tells me Precious and Industrial metals may be the best play in the 4th quarter as risk aversion reigns supreme. Unless of coarse one likes Government Debt.

Related ETF's: iShares Barclays 10-20 Year Treasury Bond Fund (TLH:US), GS Connect S&P GSCI Enhanced Commodity Total Return Strategy Index ETN (GSC:US), ETFS Palladium Trust (PALL:US), E-TRACS UBS Long Platinum ETN (PTM:US)

Literature: Karl R. Popper's The Open Society and Its Enemies 2 Hegel and Marx

Sports: T-Mac finally gets another shot. Former Superstar Tracey McGrady officially Signed with the Detroit Pistons today. Detroit's backcourt is crowded.

Patrick M. Ambrus
Analyze Capital LLC
Twitter: Analyze Capital

Tuesday, August 3, 2010

Pending Home Sales and Quick & Dirty Market Update


Pending home sales index fell 2.6 percent in June to 75.7. Year-on-year the index is down 18.6 percent. Sales were down in three of regions. The National Association of Realtors is warning that near-term sales of existing homes are likely to be "notably lower" in contrast to the spring surge which was fed by government stimulus.

Bloomberg.com


Oil, Gold, and Silver continue to move higher today. Will Oil reach $85/b this week? It is hard to say. Tomorrow's EIA numbers ought to be interesting. Maybe Demand will pick up in correlation with weak supply figures.

Global Equities tanked today highlighted by the CSI's drop of more than 50 points or 1.76%. The SPX is almost even on the day after a vigorous morning sell-off. Will we test 1130 today?

Global Debt markets continue to rally today. Even apetite for Greek 10 year notes picked up. U.S. 10 years are up over 45 bp and yield 2.91%.

Did I mention we have a weak dollar as well? I forgot, you already knew that. EUR/USD = 1.3235 as I type.

Related ETFs: iShares Silver Trust (SLV:US), iShares Dow Jones US Real Estate Index Fund (IYR:US), ProShares UltraShort 20+ Year Treasury (TBT:US)

Sports: You know its August when Brett Favre retires again. Let the drama ensue.


Patrick M. Ambrus
Analyze Capital LLC
Twitter: AnalyzeCapital

Tuesday, July 13, 2010

Jesse Livermore/Natural Gas Update- 07.13.2010


And the Magic number is? $4.35. If we see a clean break below this level I expect NG to test the next levels of support at $4.15. Volume confirmation is key. Prices have traded in a narrow range the past four days due to "forecasts of moderate temperatures in the U.S. Midwest and Northeast later this month," according to commodityonline.com.

On a positive note, the 50 day SMA looks to be converging with the 100 day SMA. Couple this with strong Supply and Demand Data and we should see a clean retest of $4.50. I will be looking for a decrease in supplies, in-ine or below estimates. Until then I will sit, wait, and hope I do not get stopped out.

"There is only one way to achieve success in speculation--through hard work, persistently hard work. If there is any easy money lying around, no one is going to try and give it to me, this I know."

--Jesse Livermore, World's Greatest Stock Trader

Monday, July 12, 2010

Nat Gas Update


Unfortunately, my position was stuck in the mud all day. NG contracts for August delivery reached a high, mid-morning EST, of close to $4.445/mmBtus. I entered at $4.45. Tonight I will watch GLOBEX trading and re-evaluate my position before NYMEX trading opens tomorrow morning. Currently prices are hovering around $4.388.

To hold it upright and fill it, is not so good as stopping in time. When you pound it out and give it a point, It won't be preserved very long. When gold and jade fill your rooms, you'll never be able to protect them. Arrogance and pride with their wealth and rank, on their way bring disaster. When the deed is accomplished you retire; Such is Heaven's way.

--Lao-Tzu, Chapter 91


Patrick M. Ambrus
Analyze Capital LLC

Thursday, July 8, 2010

Nat Gas Inventories/Trade


Natural gas in storage rose 78 billion cubic feet in the latest week. An injection of 70 bcf was expected.

Bloomberg.com


As one can see from the chart, I purchased some August NG contracts on the the oversupply news. My stops are set around 4.35. Though, I expect to ride this trade out over the next day and half. My price target is $4.53/MMBtu. I will keep you updated on any new developments.

Patrick M. Ambrus
Analyze Capital LLC
analyzecapital@gmail.com

Wednesday, July 7, 2010

Oil Update- 07.08.2010


Yesterday afternoon I bought some CL futures at a price of $72.60/barrel. My call has paid off thus far as crude is floating to $75/barrel. I will take some profits in the morning and re-evaluate from there. I may wait to see the EIA data before I make my trades for the rest of the week. Stay tuned!

Related ETFs: PowerShares DB Crude Oil Short ETN (SZO:US), United States 12 Month Oil Fund LP (USL:US), PowerShares DB Crude Oil Double Short ETN (DTO:US)

Patrick M. Ambrus
Analyze Capital LLC
AnalyzeCapital@gmail.com

Monday, July 5, 2010

Market Update- 07.05.2010


Equity Indicies

Europe
ESTX 50 € Pr 2,516.09 -6.27 (-0.25%)
FTSE 100 INDEX 4,839.44 1.35 (+0.03%)
CAC 40 INDEX 3,340.48 -7.89 (-0.24%)
DAX INDEX 5,830.93 -3.22 (-0.06%)
IBEX 35 INDEX 9,317.40 66.60 (+0.72%)

Asia
NIKKEI 225 9,266.78 63.07 (+0.69%)
HANG SENG INDEX 19,842.20 -63.12 (-0.32%)
S&P/ASX 200 INDEX 4,222.10 -16.60 (-0.39%)

Commodities

Energy
BRENT CRUDE FUTR (USD/bbl.) $71.570 -0.080 (-0.11%)
WTI CRUDE FUTURE (USD/bbl.) $71.880 -0.260 (-0.36%)
GAS OIL FUT (ICE) (USD/MT) $614.750 -0.750 (-0.12%)
NATURAL GAS FUTR (USD/MMBtu) $4.798 0.111 (+2.37%)

Metals
GOLD 100 OZ FUTR (USD/t oz.) 1207.700 0.000 (+0.00%)
SILVER FUTURE (USD/t oz.) 17.780 0.061 (+0.34%)

Debt
UST 10Y Price: 104.47 Change:+0.03 Yield: 2.97 Change: +/- 0.00
GBund 10Y Price: 103.94 Change: +0.32 Yield:2.54 Change: -0.04
Gilt 10Y Price: 111.71 Change: +0.27 Yield:3.32 Change: -0.03
JGB 10Y Price: 101.66 Change: -0.20 Yield: 1.12 Change: +0.01

Foreign Exchange
EUR-USD 1.2518
GBP-USD 1.5093
USD-JPY 87.7510
EUR-JPY 109.873
AUD-USD 0.8389
USD-CAD 1.0662
USD-CHF 1.0673
USD-HUF 228.0350

Today I won't be trading. I am taking this Independence Day Holiday break to catch up on some work and clear my head for the rest of the week. Last week I closed out my long USD-CAD position and scored about 200 pips. Also, I managed to close out my short Nat Gas position unscathed with some decent profits.

NBA free agency began on Thursday July 1st. It already looks as if we have Amare Stoudemire wrapped up in 5 Year/$100 MM contract. Please Basketball gods, deliver LeBron to The Knicks.

Enjoy the beach!

Related ETFs: iShares MSCI Emerging Markets Index Fund/United States (EEM:US), Vanguard Emerging Markets ETF (VWO:US), Direxion Daily Emerging Markets Bull 3X Shares (EDC:US)

Patrick M. Ambrus
Managing Partner
Analyze Capital LLC
ambrus.anlzgroup@gmail.com

Wednesday, June 23, 2010

Market Update-06.23.2010


Equity Indexes
INDU- 10298.40 4.92 (+0.05%)
NASDAQ- 2254.23 -7.57 (-0.33%)
SPX- 1092.04 -3.27 (-0.30%)

Commodities
WTI Crude Oil- $76.14 -0.21 (-0.28%)
Brent Crude Oil- $76.270 -1.770 (-2.27%)
Natural Gas- $4.7990 -0.005 (-0.10%)
Gold Spot- $1238.00 3.20 (+0.26%)
Silver Spot- $18.585 0.081 (+0.44%)

Bonds
2 Year UST- Price:99.89 (-0.02) Yield: 0.68% (+0.68)
10 Year UST- Price:103.20 (-0.02) Yield: 3.12% (-0.05)
10 Year Gilt- Price:110.75 (+0.17) Yield: 3.43% (-0.02)
10 Year Bund- Price:103.05 (+0.39) Yield: 2.64% (-0.04)
10 Year Oats- Price:103.51 (-0.11) Yield: 3.08% (+0.01)
10 Year JGB- Price:101.32 (+0.12) Yield: 1.15% (-0.04)
10 Year Greek- Price: 74.97 (-2.91) Yield: 10.36% (+0.59)

Foreign Exchange
EUR/USD = 1.2313
GBP/USD = 1.4973
USD/JPY = 89.9340
USD/CAD= 1.0394
EUR/JPY = 111.1698
EUR/HUF= 279.5028

Equity Index Futures
Nikkei 225- 9,950.00 +50.00
Hang Sang- 20,935.00 +96.00
SPI 200- 4,481.00 +8.00

10 year Greek debt is now trading at a whopping 772 bp over 10 year Bunds. It will be nearly impossible for the Greek government to roll over their debt in private markets or access short-term financing for their day-to-day operations, if spreads continue to widen. Unfortunately this story did not get enough play today.

The U.S. economy was front and center. Bernanke reminded us he and his team can continue to drop money out of the FED's helicopter if needed. Kansas City President Hoening was the lone dissenter today.

I took some profits on my SPX puts early in the session today. Tomorrow I'm looking to go long Nat Gas for part of the session. Crude is in play too.

By the way, All Kobe does is win! Good luck trading tomorrow!

Related ETF's: United States Oil Fund LP (USO:US), United States Natural Gas Fund LP (UNG:US), United States 12 Month Natural Gas Fund LP (UNL:US)

Patrick M. Ambrus
Analyze Capital LLC
ambrus.anlzgroup@gmail.com

Monday, June 21, 2010

Market Update- 06.21.2010


Equity Indexes
INDU- 10,442.41 -8.23 (-0.08%)
NASDAQ- 2,289.09 -20.71 (-0.90%)
SPX- 1,113.20 -4.31 (-0.39%)

Commodities
WTI Crude Oil- $77.49 -.33 (-0.42%)
Brent Crude Oil- $78.560 -0.260 (-0.33%)
Natural Gas- $4.870 -0.003 (-0.06%)
Gold Spot- $1237.400 -3.300 (-0.27%)
Silver Spot- $18.780 -0.074 (-0.39%)

Bonds
2 Year UST- Price:100.06 (-0.02) Yield: 0.72% (+0.01)
10 Year UST- Price:102.13 (-0.05) Yield: 3.25% (+0.03)
10 Year Gilt- Price:110.09 (+0.26) Yield: 3.51% (-0.03)
10 Year Bund- Price:102.01 (-0.33) Yield: 2.76% (+0.04)
10 Year Oats- Price:103.28 (+0.03) Yield: 3.10% (+0.00)
10 Year JGB- Price:100.67 (-0.11) Yield: 1.23% (+0.02)
10 Year Greek-Price: 79.53 (-0.36) Yield: 9.48% (+0.07)

Foreign Exchange
EUR/USD = 1.2320
GBP/USD = 1.4760
USD/JPY = 90.9250
USD/CAD= 1.0238
EUR/JPY = 112.2393

Equity Index Futures
Nikkei 225- 10,140.00 -90.00
Hang Sang- 20,970.00 591.00
SPI 200- 4,575.00 -24.00

I don't have too much to say about market movements today. Though, I will leave you with this:

One of the practical limitations of Black-Scholes is that the actual behavior of shares in the real world appears not to conform to the pattern we would expect from a single bell curve.

--A. Chisholm

N. Taleb would call this "The Great Intellectual Fraud". Good luck trading tomorrow.

Related ETF's: FXC:US CurrencyShares Canadian Dollar Trust, USL:US United States 12 Month Oil Fund LP, SSO:US ProShares Ultra S&P500

Patrick M. Ambrus
Managing Partner
Analyze Capital LLC
Twitter: AnalyzeCapital

Wednesday, June 16, 2010

Daily Market Recap-06.16.2010


Equity Indexes
INDU- 10,409.46 4.69 (+0.05%)
NASDAQ- 2,305.93 0.05 (+0.00%)
SPX- 1,114.61 -0.62 (-0.06%)

Commodities
WTI Crude Oil- $77.560 0.620 +0.81%)
Brent Crude Oil- $78.120 1.020 (+1.32%)
Natural Gas- $5.017 -0.172 (-3.31%)
Gold Spot- $1231.400 -3.000 (-0.24%)
Silver Spot- $18.465 -0.113 (-0.61%)

Bonds
2 Year UST- Price:100.05 (+0.05) Yield: 0.73% (-0.02)
10 Year UST- Price:102.00 (+0.34) Yield: 3.26% (-0.04)
10 Year Gilt- Price:109.91 (+0.15) Yield: 3.53% (-0.02)
2 Year Schatz- Price:100.01 (+0.25) Yield:0.50% (-0.012)
10 Year Bund- Price:102.85 (+0.28) Yield: 2.67% (-0.003)
10 Year Oats- Price:103.21 (-0.05) Yield: 3.11% (+0.01)
10 Year JGB- Price:100.49 (-0.09) Yield: 1.24% (+0.01)

Foreign Exchange
EUR/USD = 1.2309
GBP/USD = 1.4733
USD/JPY = 91.4500
USD/CAD= 1.0244
EUR/JPY = 112.5685

Equity Index Futures
Nikkei 225- 10,040.00 -50.00 (-0.50%)
Topix- 893.50 -1.00 (-0.11%)
Hang Sang- 20,145.00 56.00 (+0.28%)
SPI 200- 4,558.00 4.00 (+0.09%)

Today I did not trade. We had some administrative issues to take care of with our platform. Tomorrow I will be back at it. I enjoyed Obama last night. Short and to the point.

The Lake Shows dominated the Celtics last night. One more victory and Kobe will have 5 rings, Phil 11. Spain lost in their opening match-up. They better pick u the pace seeing as I have them winning it all.

Related ETFs: FXB:US Currency Shares British Pound Sterling Trust, DUG:US ProShares UltraShort Oil & Gas

Patrick M. Ambrus
Managing Partner
Analyze Capital LLC
Twitter: AnalyzeCapital

Oil Near One-Month High


Bloomberg:
Crude oil traded near a one-month high in New York as gains in U.S. equities restored confidence that fuel demand will increase.

Oil earlier extended yesterday’s 2.4% jump after the dollar index dropped 1.7 percent in the past two days, increasing the appeal of commodities as an inflation hedge. The Dow climbed 2.1% while the S&P 500 gained 2.4%.

Crude oil for July delivery was at $76.92 a barrel, down 2 cents, on the NYMEX at 10:52 a.m. Singapore time. The contract surged $1.82 yesterday to $76.94, the highest closing price since May 6. Futures are up 9.2 percent from a year ago.

Crude broached a closely watched pricing point yesterday, closing above the 200-day moving average of $76.94 a barrel for the first time in a month.

Oil’s gains yesterday were tempered after the industry- funded American Petroleum Institute reported that U.S. crude-oil stockpiles rose 579,000 barrels to 358.7 million.

The Energy Department will probably report that U.S. gasoline inventories were little changed last week, the Bloomberg News analyst survey shows. Stockpiles of distillate fuel, a category that includes heating oil and diesel, are forecast to climb 1 million barrels. The department is scheduled to release its weekly report at 10:30 a.m. EST.


Thoughts:
At the moment, I am leaning toward being bullish on crude until the end of the summer. However, I do not want to make a definite stance until I can find more information relating to supply. I am convinced that demand will continue to grow in the U.S., due to increased gasoline usage during the summer and slow economic recovery, and in emerging economies, due to continued economic growth. If supplies show strong signs of decline, then crude will continue its rally.

Daniel A.
Summer Analyst
Analyze Capital LLC

Monday, June 14, 2010

Market Recap- 06.14.2010


Equity Indexes
INDU- 10,190.89 -20.18 (-0.20%)
NASDAQ- 2,243.96 0.36 (+0.02%)
SPX- 1,089.63 -1.97 (-0.18%)

Commodities
WTI Crude Oil- $75.060 1.280 (+1.73%)
Brent Crude Oil- $74.970 0.620 (+0.83%)
Natural Gas- $5.030 0.249 (+5.21%)
Gold Spot- $1222.800 -7.400 (-0.60%)
Silver Spot- $18.235 0.004 (+0.02%)

Bonds
2 Year UST- Price:100.03 (-0.02) Yield: 0.73% (+0.01)
10 Year UST- Price:102.02 (-0.22) Yield: 3.26% (+0.03)
10 Year Gilt- Price:109.83 (-0.72) Yield: 3.54% (+0.08)
2 Year Schatz- Price:100.01 (-0.06) Yield:0.49% (+0.30)
10 Year Bund- Price:103.14 (-0.64) Yield: 2.63% (+0.07)
10 Year Oats- Price:103.40 (-0.59) Yield: 3.09% (+0.07)
10 Year JGB- Price:100.54 (-0.11) Yield: 1.24% (+0.00)

Foreign Exchange
EUR/USD = 1.2228
GBP/USD = 1.4751
USD/JPY = 91.5300
USD/CAD= 1.0325
EUR/JPY = 111.9850

Equity Index Futures
Nikkei 225- 9,890.00 10.00 (+0.10%)
Topix- 878.00 2.00 (+0.23%)
Hang Sang- 20,089.00 241.00 (+1.21%)
SPI 200- 4,528.00 2.00 (+0.04%)


Big moves in commodities markets today. Natural Gas was up over 5% on concerns of a worse then expected hurricane season. Crude oil also rallied. U.S. Equities were marginally positive throughout the day with the SPX briefly trading @ 1103. The Dollar paired back some gains from last week's strength. Today, I monitored my positions but did not actively trade.

The Lakers lost last night. Celtics now lead the series 3-2. I still expect LA to win the its 2nd consecutive championship. In world cup news Netherlands beat Denmark 2-0 on some goal keeping errors. Tomorrow Portugal takes on Ivory coast at the start of U.S. equity trading.

Realted ETF's: SPY:US SPDR S&P 500 ETF Trust, DIG:US ProShares Ultra Oil & Gas

Patrick M. Ambrus
Managing Partner
Analyze Capital LLC
Twitter: AnalyzeCapital
 
Disclaimer
This Blog has been developed by Analyze Capital LLC, and as an independent organization we provide “AS IS” information without warranty. The ideas and opinions expressed by the contributers of this blog are personal and do not represent the actions or policies of Analyze Capital LLC. The contents of this blog do not intend to assert recommendations or to offer advice of any kind. We are not responsible the consequences, be they gains or losses, that may result from using any of the information from this blog.