rss
email
twitter
facebook
Showing posts with label trading. Show all posts

Friday, April 1, 2011

End Month Performance of March (21st to 31st) - April 1st 2011

Traded the fourth week of March but not the last.


4th Week Performance -  March 21th - March 25, 2011

  • Open Week - Long GBP/USD @ 1.6233 from last end week - Closed @ 1.63077 - March 21, 2011
  • Open Week - Long WTI @ 102.28 from last end week - Closed @ 104.97 - March 22, 2011


WTIGBP/USDTotal CentsTotal Pips
+269 cents+74 pip+269 Cents74 pips


This was the performance from within the week though both these positions were initiated from two weeks ago and were unrealized gains.

The overall realized P&L:


WTIGBP/USDTotal CentsTotal Pips
+27 cents+198.7 pip+27 Cents198.7 pips


  • As you see from the realized P&L my second crude trade for the month was timed extremely poorly. For about a week and a half WTI was in down trend for about 2 ATRs. I sat through 2 ATRs of uncomfortable volatility. The proper risk management would have been to set stop loss at 1 ATR reassess on the third week then sat through another 1 ATR of downside volatility and setting it wide enough to be able to catch the recovery that we saw end month. That strategy would have garnered at least 300 - 400 cents vs the 27 cents I realized.  In the end though I'm glad I stuck to my views and convictions of seeing the 105 squeeze I was looking for. The move going into April is another story on its own for another day to tell...
  • GPB/USD trade was overall a very solid trade. I caught about 66% of the move up to about 1.64. I bailed early because I was going out of town and didn't want to manage my position when I was away. Also, wasn't sure how the UK inflation report was going to turn out. Even If I stuck through the inflation report which would have been about 100 pips more, the reversal was hard and fast and probably difficult to time. If anything I would have resulted in the same realized P&L. I sat through about Daily volatility of 100 pips or so before the move took off. 1 ATR risk management would have been sufficient but I was using broad 1.60 base support. 


So my total trades for the month of March realized P&L:

Total CentsTotal Pips
+981 cents+32 pip


Majority of cents come from crude exposure on front month trades (Brent, WTI) and with one week trading the dollar index.

The reason why the pips are so low was because of my poor poor poor NZD trade. Talk about bad timing. Fundamentally I was right but was trying to fight the crowd. In the end the move I wanted came and again came much faster than I expected. The pound was an excellent trade and had I de-leveraged a bit on my NZD trade the pip significants would have been greater. Either way 32 pips is better than negative pips.

Overall a very good positive month thanks to energy trades. My second trade was almost a disaster but I stuck it through. Better risk management would have improved P&L significantly. Got to stick to the discipline...


Analyze Capital LLC
AnalyzeCapital(at)gmail.com 


Tuesday, November 16, 2010

The Three Wise Men


Yesterday was 13-F day in Hedge Fund land. Thus, average speculators (us included) got to peep the holdings of our more well endowed/experienced competitors. Specifically, we now know who owns what. There were no real surprises. So without further adieu let's dive in...

Buffet


We believe that according the name 'investors' to institutions that trade actively is like calling someone who repeatedly engages in one-night stands a 'romantic.'

We surmise Mr. Buffet aimed this quote at those investment banks (Goldman ahem) whose P&L fluctuate due to a voltile revenue stream based on FICC trading.   Mr. Buffet is a man of his word and went hunting for steady revenue streams. Hence, he purchased 1.99 million Bank of NY Mellon shares. BK is a well diversified Financial Services conglomerate and does not rely on investment banking as a main stream of income. In addition, Mr. Buffet upped his stake in WFC by 16.5 million shares bringing his total to 336.4 Million. He increased his stake in Well Fargo four out of the last seven fiscal quarters. We believe Mr. Buffet is betting on WFC's traditional savings and loan franchise, borrow at 0 current rates and lend at higher rates. Meanwhile, he still holds Goldman's feet to the fire with those warrants he purchase at $125/share during the heart of the crisis.

Finally, Berkshire increased their cash position by 23% to $34.5B from $28.05 B last quarter. Mr. Buffet eliminated his stake in Home Depot, reduced his stake in Nike by 52%, and and sold nearly his entire Comcast stake, 12 million shares. Thus, Berkshire Hathaway's equity sales outpaced purchases by $1.2 billion. Let profits run and cut the losers!

Soros


An open society is a society which allows its members the greatest possible degree of freedom in pursuing their interests compatible with the interests of others.

Indeed it is. Mr. Soros exercised his right to pursue interests compatible with others in that he took some profits and diversified his Gold positions. Soros Fund Management Sold approximately 550,000 GLD shares last quarter and now hold a cool 4.7 million. This is significant in that the Soros' holdings are down from 1.5 Million GLD shares under management from the peak in December of 2009 when 6.2 million shares were held.  As we noted in our last post, the gold trade is a crowded one and the GLD is the most popular vehicle. In lieu, Mr. Soros diversified his holdings and purchased 5 million shares of The BlackRock managed iShares Gold Trust (IAU). Again, no surprises here. If we recall correctly, Soros called Gold the ultimate bubble not too long ago. Suffice it to say he still feels this way.


John Paulson


There is a chance – a very good chance – that gold will be the next NASDAQ.

Mr. Paulson shows some hubris. To our delight he puts his money where his mouth is. Paulson & CO. maintained 31.5 million shares of the SPDR GLD ETF, approximately 7.4% of the entire float, last quarter. Essentially, he must think $1500 Gold will come sooner than later. Also, Mr. Paulson was a heavy seller of financial equities. Paulson & Co. sold 1.1 million GS shares, 82.7 million C shares, 2 million JPM shares, 2 million WFC shares, and 30 million BAC shares. For what its worth, this may explain negative HF bias towards the XLF last quarter and go a long way into explaining why financials did not participate in the September/October equity rally. Though we are not conspiracy theorists here, just backward guessing speculators.

Comments


Even though we did not rigorously detail the nuances of each manager's portfolio, the major changes were noted. What do we think? Safety and profit taking were the prominent themes. Soros ensured he has more liquidity in case Gold dips. Buffet took the consumer-related risk out of his portfolio. Paulson reallocated capital and took money off the table a la profits and losses in financials. Why are these men wise? All three stuck to their principle investing thesis. In times of turbulence many of us question our positions, logic, rationale, and sanity. However, it is times like these in which we can also become wise men and clarify our unique trading styles.

-Patrick M. Ambrus

Sources: bloomberg.com, cnbc.com, ft.com, thelordoftrading.com

Tuesday, November 9, 2010

The Tower of Terror: Going Down?


Today was a wild ride. We hope most of you who were long as of this morning either own protection or had stop loss orders in place. Most asset classes tanked on the heels of a poor 10 Year Treasury Note auction at 13:00 EST. The Dollar strengthened as U.S. equities bled and Oil dipped below $85.60/barrel. On a positive note, The Ag trade remained resilient thanks to bullish data from the USDA report this morning. In particular, Raw Sugar was up almost 4% and closed at $0.3311. Yet, out of all this unexplainable excitement today's zippy price action in Gold piques our curiosity the most.

Gold traded up to new all-time highs of nearly $1425 per Troy ounce before its precipitous sell-off to $1385. Wow, a $40 range in one session! Surely, we will not take this abrupt volatility lightly. Or shall we?

December Nymex GC

Even though GC sold off materially after its morning erect, none of us should gasp in awe. Gold is everywhere. The likes of ESPN, NBC, and even NBA TV (yes) bombard us with daily commercials pedaling the 'once in a life-time opportunity' to own the not so rare/often ignored physical form of the precious metal. In addition, we watch in silence as the members of the far right such as Glen Beck hypnotize our fellow men into believing that bullion is the only asset capable of protecting us from the imminent economic collapse (Rubbish we say, moldy rubbish). Also, Gold frequently claims the front-page headlines of local, national, and international information (what really qualifies as news these days?) periodicals. In short, Gold is ubiquitous.

Regardless of Gold's correlation/pricing with/in the U.S. Dollar the precious metal has now become a speculative trading vehicle rather than an inflation/deflation/sovereign debt/economic collapse/financial armageddon hedge. Don't believe us? Let us briefly examine the SPDR Gold Shares (GLD) ETF. In the period between October 1 - November 8 on average 17.75 million shares of GLD changed hands daily. In the prior 27 trading days average volume came in at only 12.1 million shares daily. With the aid of an envelope, we calculate this increase in volume to be nearly 47%! Also, as of GLD's Q2 SEC filing approximately 96 million new shares were created. This brings the total shares outstanding to a whopping 434 million. Hence, more retail investors joined the game.

Where do prices go from here? Up, Up, and away. The Federal Reserve's quantitative easing program will most likely impede any progress the dollar makes, and thus openly encourage irresponsible commodity speculation. Also, do not let us discount emerging market demand stemming from a desire to diversify reserves away from U.S. Treasuries (yes we point to China). Finally, we will be wise and remember that a bubble only becomes a bubble once the masses are aware. This point is of critical importance to remember while prices sail to uncharted territory.

-Patrick M. Ambrus

Sources: bloomberg.com, finance.yahoo.com, spdrgoldshares.com, USDA.gov

Disclosure: No Positions


Monday, October 25, 2010

Ready For War


So let there be no battle on a ground of dissolution, let there be no stopping on light ground, let there be no attack on ground of contention, let there be no cutting off a trafficked ground.  On intersecting ground form communications, on heavy ground plunder, on bad ground keep going, on surrounded ground make plans, on dying ground fight.  --Sun Tzu

Let us agree to disagree.  If any message is to be taken from this weekend's meeting of G20 finance Ministers that was it.  The Group agreed in principle not to wage a malicious currency war in which 'beggar thy neighbor' and 'fastest to the botton' monetary policies apply.  In addition, the Ministers of Finance also agreed that matters of foreign exchange policy are simply over their collective heads of wisdom. Hence, no 'Plaza Accord 2' will take place until The Group of 20 Seoul Summit on November 11-12.  Hurray!  Now we are free to continue speculation on impending Quantitative Easing from the FED without any worries of a 'currency war.'

We shall shift our focus to the United States.  This week we will receive stone cold housing data from Monday to Wednesday with Consumer/Investor Confidence reports and Durable Goods orders sprinkled on top.  What a sweet Cupcake this will be.  On Thursday the market will have a chance to digest with a soothing cup of tea or pepto depending on elusive Jobless Claims data. Finally, Friday may bring us a basket of fresh or moldy fruit with GDP, Employment Cost Index, Chicago PMI, and Consumer Sentiment.  

Wow, this week's economic calendar provides us with copious amounts of noise to trade around, into, and through.  The noise becomes deafening if we look at German CPI, BOJ announcement, British GDP, German Unemployment, and Japanese Industrial Production.  The aforementioned data set does not encompass the entire set of data releases, only what we think is important.

Switching gears, let us not forget about earnings from Ford, Kimberly-Clark, UBS, ConocoPhillips, Deutsche Bank, Visa, 3M, Banco Santander, Microsoft, China Construction Bank, Constellation Energy, Merck, NASDAQ OMX, and Total.  Ford, 3M, Visa, and NASDAQ OMX pique our interests the most.  

Alas, we arrive at the question of the hour; 'how does one trade markets this week?'  Unfortunately, we lack the definitive foresight necessary for profitable speculation at this time.  However, circumstances may change rapidly and swiftly.  Do yourself a favor and trade the trends.  If no trends exist trade the ranges.  If the range trades are missed be patient, make plans.  The Lords of Trading will part the waters in due time.

--Patrick M. Ambrus  

Sources: Bloomberg.com, Finance.yahoo.com, CMEgroup.com, The Art of War

Tuesday, October 19, 2010

Hurricane China Watch


22:40- Commodity Update

WTI CL- November ‘Crude oil rose, recouping part of the biggest loss in eight months, as China’s interest rate increase added to signs of economic growth and analysts forecast a decline in U.S. fuel stockpiles. Futures gained as much as 0.4 percent after dropping 4.3 percent yesterday, the biggest decline since Feb. 4.’

November Crude trades at $79.90/b up $0.30. December Crude trades at $80.50/b up .37%. Globex shows December contract volume of 4.8k. Due to impending expiration on Wednesday, November crude only traded 481 contracts as of writing.

‘The Energy Department report today may show U.S. gasoline inventories fell 1.5 million barrels, according to the median of 16 analyst estimates in the Bloomberg News survey.’ (Bloomberg.com)

Natural Gas- NG contracts expiring on October 27 continue to pick up traction from yesterday’s session in which prices rallied more than 2%. The front month contract is up by .51% to 3.538.

GC- Gold was crushed in yesterday’s session and traded down by $40 on December contracts. The precious metal is up by $3.50 to 1337.10/Toz.

Copper- After trading down to 3.7250 throughout the NYMEX session, HG gained some traction during Globex trading. The Red base metal December contract is up by .94% to 3.7655.

22:30- FX Commentary

EUR/USD- The Euro has weakened a bit since the blood bath, across all asset classes, at the close of NY trading. The pair traded as low as 1.3700 @ 20:00. The slight breach of 1.37 triggered heavy buying up to 1.3750. Since then the pair has bounced and now trades higher by 58 pips from the lows to 1.3758. The pair is up 34 pips on the session.


USD/CHF- The ‘Swissy’ traded down to .9680 at 21:50 from session highs of .97185 at 20:00.  The pair is weaker by 32.5 pips on the session and was last quoted at .9686.
AUD/USD- Watching this pair is almost as much fun if not more fun than the viewing the  EUR/USD trade.  The Aussie dropped to .9665 at 20:00 and paired all losses to touch a session high of.9742 at 21:45.  The pair now trades at .97375.


Trading Economics
Many Commodity traders who held Net long positions may have been caught off-guard when The People's Bank of China explicitly announced hawkish monetary policy in order to curb inflation:
"China's benchmark rates are not an overnight lending rate as is the case in the United States and other major western economies. Instead, it has a one-year interest rate on saving deposits, which increased to 2.5% and a one-year interest rate on loans, which rose to 5.56%." (CNNMoney.com)


GDP, CPI, PPI, Retail Sales, and Industrial Production data are to be released tomorrow evening.  Economists expect the Chinese economy grew by 9.5% yoy in the third quarter of 2010.  Any growth figures over 10% ought to unleash the commodity bulls from the proverbial cage they were placed in today.

-Patrick M. Ambrus

Sources: Bloomberg.com, Economy.com, listown.com, CNNMoney.com

Wednesday, September 29, 2010

Navigating Global Capital Markets


Trading FX is right now is like navigating the Amazon River, 'Grey Swans from Extremistan' lurk around every land mass..... As the often quoted John Maynard Keynes once advised, "The market can stay irrational longer than you can stay solvent."
    Credit Default Swaps on Irish, Portuguese, Greek, and Spanish Debt continue to widen. Anglo Irish debt was downgraded by Moody's on Monday and now needs another lifeline of 5B Euros.  Yet, the Euro continues to strengthen.  Mr. Bernanke and Mr. Obama must be smoking a fine Cuban cigar at the moment because they are the only 2 policy makers of recent memory to weaken their currency without  significant lip service.  The Japanese MOF should take the lesson...start a trade war with China and watch your currency tank...There is much fear in holding US Dollars at the moment.  Mr. Guido Mantega of Brazil is right, we do have a full fledged currency war of devaluation and the U.S. is winning.
      Also of note, Mr. Yu Yongding an advisor to The People's Bank of China spoke in Singapore  of a full fledged dollar crisis, to quote the man, "Such a huge amount of debt is terrible and the situation will be worsening day by day.  I think we are one step nearer to a US Dollar crisis."  Cheers to you too mate.
        This morning AUD is off its highs of .9780 levels seen in Tokyo trading overnight and has pulled back toward .9700 levels.The AUD continues to test new highs as it inches towards parrity with the USD and makes new highs against the JPY.  Though, the latter has internal economic issues of its own which continue to put downward pressure on any of the Yen's major pairs.  The appreciation in large is due to sustained demand for Australian base/industrial metals from China and ASEAN countries in general.  Also, Australia maintains the highest nominal interest rates, currently at 4.5%, of any G20 country and thus is perfect for a reverse carry trade involving the USD.  Ironic how times have changed.  I can remember the days when U.S. assets became the beneficiary of an Asia Pacific carry trade.  And then we had a realestate market collapse in correlation with all other asset classes for that matter....Low rates, continued AUD strength!
          Meanwhile, the only commodities that want to rally are precious metals...Agri commodities crashed like the titantic yesterday and continue to hit icebergs today.   This is possibly due to the recent sanctions China placed on imported U.S. Chickens.  Chickens love grains as a main source of their diets.  Also, the recent run-up in Agri prices does justify a correction if prices are to move higher in the 4th Quarter.  Natural Gas is trading lower and Oil cannot hold on to any incremental gains.  Though API data from last night was somewhat bullish, and DOE data should help prices firm a bit, but their is no support in sight. Nat Gas is suffering from a lack of supply scarcity.  In fact new inventories appear every day and remain above our famous 5 year average range.  Yet, this makes little sense considering storage capacity and new LNG technologies make storage and shipment of the energy easier and cheaper than ever. I will note that Sugar, Cocoa, and Coffee performed well in yesterdays session largely attributed to you guessed it, dollar weakness.
            Bill Gross published a grim outlook in his October outlook letter.  He highlighted Stan Drunkenmiller's retirement as a Harbinger of things to come in the fund management industry.  He argues that the days of double digit returns are over due to a lack of asset inflation, increased regulation, and deregulation.  Indeed these things are all true.  One must take Mr. Gross' comments with a grain of salt as he manages the world's largest bond fund in PIMCO.  His comments do coincide with a 10% workforce reduction at DE Shaw, one the world's largest Hedge Funds with approximately $21 B of assets under management.  HF's are struggling to produce alpha these days.  According to HFN Hedge Fund Aggregate Index funds are up only 0.14% YTD through June 2010.  The FT reports Hedge funds are up 1.45% YTD.  Times are grim when the best managers of money can't make a buck.
              It is understandable that there is an underlying current of fear surrounding the developed markets of the world.  Emerging Markets were thrust into the spotlight during the most morbid of days during the credit crisis and have been in the spotlight since.  OECD economies continued to point to Emerging Market Demand and growth as the way of the future and how this shift is a 'structural' one that will change the way the global markets do business.  All I can say is, not so fast jack.  Without demand for emerging market exports from developed economies there will be no new growth.  Unless of course the ubiquitous Emerging Markets can create a sustainably contempory domestic demand system for domestically produced goods.  I doubt Malaysia needs all those those textiles and garments they continue to churn out.

              Undoubtedly, big corporates still reside in developed markets.  Inventories have refilled after bone dry levels spawned a rampant increase in production over the last 2 quarters.  Thus, unless OECD demand returns to the global marketplace, emerging markets will not be able to maintain their 'robust' growth systems and will inevitably slow down.  Global 'Austerity' is in order.  We should all trade accordingly.

              Patrick M. Ambrus
              Contact: analyzecapital@gmail.com

              Sources: Financial Times, The Gartman Letter, Bloomberg.com, HFN.com, The Black Swan, PIMCO.com

              Monday, September 27, 2010

              Headwinds of Change

              Unpredictable Market Forces at Work


              After a positive week for U.S. equities, market action lacks directional impetus. What will drive equity markets higher? It is clear to us window dressing season is in full effect. Many fund managers and Institutional Investors continue to pile into crowded, growth-oriented, and alpha-seeking equity trades. In addition, many prominent investment bankers sitting in the position of 'Head of Global Equities', at their respective shops, continue to preach 1300 on the SPX by year end. Is this feasible? Sure, but it is not likely.

              Much of the current rally in the SPX from August lows of 1015 has been due to a weaker USD across the board. One can argue the impact of illustrious economic data releases on price swings until blue in the face. Yet, since the fear of debt contagion in the Euro-zone abated panic and worry shifted back on the country with the world's largest Gross Domestic Product. Since then, the EUR, CHF, JPY, and AUD have all made substantial advances against the 'Greendback'.


              Down Under


              Australia continues to benefit from their trade relationships with Asia in that exports of commodities have led to sustainable growth down under. The economy picked up last month creating 29,000 new jobs predominantly in construction and industrial sectors. As long as Chinese demand for iron ore, copper, and aluminum remains consistent, thE AUD Will continue to appreciate against all major pairs.


              Efficiency


              The 'Swissy' benefits predominantly from the risk-on/risk-off trade. The linguistically diverse country maintains a current account surplus of 8.9% of GDP, inflation hovers around 1% while unemployment is below a comfortable 4%, and 2011 GDP growth forecasts 2% growth. If one wants safety what is not to like? In addition FX traders seem poised to test the patience of the SNB again. Recall when the SNB stepped in with 'unilateral intervention' and sold Swiss Francs to keep the rate above 1.30 EUR/CHF. Will they sell Francs and buy Dollars? No, the Japanese already failed in this endeavor.


              Tradition


              The Japanese economy, like the U.S., is struggling to maintain growth. Deflation wanes in the balance and export demand is tailing off in large due to a strong currency and shrinking profit margins at the likes of Sony, Toyota, Bridgestone, and Kobe Steel. With a dire economic situation the MOF stubbornly talks up the JPY and the need for intervention. Though, by 'unilaterally intervening' in the FX markets already traders know the MOF has a gun. The question is how many bullets are in the gun, and does the Ministry possess the courage required to fire a full clip? Time will tell on the latter. I doubt we have seen the last of 'unilateral intervention'. Speculators who place bets in JPY strength will not learn until the MOF reverts back to 2004 tactics and dilutes the market with over $1 Trillion of Yen. Whether or not Kan's $55 B stimulus package helps weaken the JPY remains to be seen.

              Lastly, I would like to touch on the political issues underpinning the currency. Since Ichiro Ozowa was ousted in his most recent attempt to gain power, Naoto Kan appeased the former's supporters with currency intervention. I trust the exporters mentioned above took note of this and will put pressure on Kan's administration to intervene again. Many have made it resolutely clear; 'we want USD/JPY rate at 95'. If Kan wants to keep his job longer than his predecessors he will intervene again and again until the Yen stops strengthening.


              The Little King of Everything


              Alas we have but one more pair to discuss, you guessed it, EUR/USD. As mentioned by Dennis Gartman this morning, 'This was the level from which the EUR plunged earlier this year... it marks almost perfectly the 50% retraetment of the EUR's collapse from the highs of 1.5200 last December to the lows of 1.1900 this spring.' 1.3500 will serve as a hard line of resistance over the next trading session. This morning around 10:00 the pair jumped above this level on a large candle to the upside. However, the pair rocketed back down to the 1.3450 levels within the next hour.

              Also, ECB buying of sovereign debt is slowing. Last week the ECB bought only 134 M EUR of bonds in comparison to 323 M EUR the week prior. Maybe the ECB feels confident the liquidity in the sovereign debt market is here to stay, only until it dries up again. Another important point to note; many Germans are becoming unhappy with the 'Christian-liberal Coalition', noted in the latest edition of the economist. Any political instability surrounding the Euro-zone's growth engine may cause uncertainty in the single currency. However, I should note that this is pure speculation on my part.

              Undoubtedly, the EUR/USD pair is driven by none other than the U.S. FED action. Various traders, analysts, and media alike expect a second round of 'Quantitative Easing' in which the FED once again opens up its balance sheet to buy U.S. Government Debt. Rumors suggest debt purchases of $1-2 Trillion of longer-term U.S. Treasuries. This is nonsense. If the FED wanted to create artificial inflation they already would have done as much. Especially considering the mid-term elections put a choke-hold on any further monetary policy action. I suspect, as a rumor from the WSJ this afternoon put it, 'Rather than announcing massive bond purchases with a finite end, Fed officials are weighing a more open-ended, smaller-scale program that they could adjust as the recovery unfolds.' Cheers. This ought to give the Bond market rally a bit more time run and allow equities to cool after a monster September.


              Impetus for Change

              Now let us examine a few possible harbinger's for a trend reversal in Dollar weakness. On Friday October first Global PMI data will release staring with CHina and ending with U.S. ISM. Last month trader's took China's moderate August reading of 51.7, up .5% from the month prior, as a reason to buy equities. The SPX rallied nearly 3% and closed up more than 30 points on the session. What would have happened if Chinese PMI came in around say 48 or 47? Equities would be in for a sharp and painful sell-off methinks. Hence, the fear of a global slowdown in consumption/demand would shift to the far east and away from the U.S. Perhaps poor EU PMI might just do the trick if the Chinese index posts 'robust' gains. Either way, I expect this data release to be a harbinger of asset allocation in the coming month.


              Trade

              We are gearing up for a switch in sentiment with a 'Strong Dollar Story' leading the charge. Specifically we like the the dollar against the CHF, CAD, and JPY. In addition, we see energy as the place to be in the coming months as seasonality changes. Be cautious though, this type of trading environment is dangerous.


              Patrick M. Ambrus
              Contact: analyzecapital@gmail.com


              Sources: The Economist, The Gartman Letter, Financial Times, FT Alphaville, WSJ.com, bloomberg.com

              Thursday, September 23, 2010

              Buoyant Natural Gas


              EIA Data release for week ending September 17, 2010:


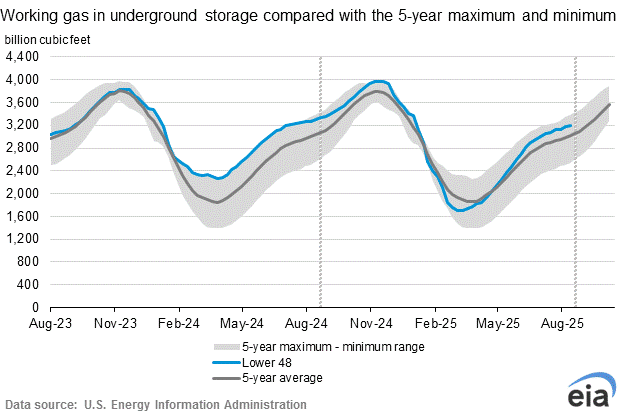
              Working gas in storage was 3,340 Bcf as of Friday, September 17, 2010, according to EIA estimates. This represents a net increase of 73 Bcf from the previous week. Stocks were 175 Bcf less than last year at this time and 195 Bcf above the 5-year average of 3,145 Bcf. In the East Region, stocks were 16 Bcf above the 5-year average following net injections of 53 Bcf. Stocks in the Producing Region were 114 Bcf above the 5-year average of 915 Bcf after a net injection of 19 Bcf. Stocks in the West Region were 65 Bcf above the 5-year average after a net addition of 1 Bcf. At 3,340 Bcf, total working gas is within the 5-year historical range.


              Price Data


              Headwinds

              A significant portion in achieving upward price momentum has been unpredictably moderate temperatures. We are in an environment in which Nat Gas is not needed for cooling nor for heating. Additionally, Hurricane season has yet to come to fruition (that is an oxymoron but rings some truth for an energy trader) and will likely continue upon its uneventful season. However, hope remains in the form of tropical storm Lisa. WIth warmer temperatures in the Atlantic, the potential for greater velocity of headwinds and illustrious destruction increases rapidly; think Hurricane Rita. If the storm hits the North East, I would look for Philadelphia output to stagnate.

              Tailwinds

              We'd like to see the November contracts find support at $4.15/mmBtu. Though the contangion spread between November/December contracts (.216) is much wider than that of December/January (.1620). A scenario could develop in which the November/December spread widens until demand firms for the near-month contracts. Otherwise, spreads should narrow as the near month November contracts gain demand traction. We expect to see sustainable support of $3.98 on October contracts expiring on Tuesday.

              December NG: 3-Month Daily Chart


              Trade

              As Alex astutely alluded to yesterday, we are long MINY December Contracts. We will look to'pyramid' once prices move into a tighter range at higher price levels, if there is such a thing.

              Patrick M. Ambrus
              Twitter: AnalyzeCapital

              Source: http://ir.eia.gov/ngs/ngs.html

              Monday, September 20, 2010

              Do Your Own Homework-SPX Update


              'Buying Gold is an excuse for people not to do their homework.'

              -Alex

              SPX: 1 Year Daily Chart:


              Another day another dollar: that is true if you were long the SPX in U.S. trading today. The SPX rallied 1.45% to 1141.92 on the session led by Energy, Consumer Discretionary, and Industrial stocks. Many Tech bellwethers displayed robust performances as Google rallied 3.7% to 508 and AAPL closed above 280 up 2.85%.

              Pop Quiz: Why did equities rally today class?


              a. President Obama's Town Hall assured investors America is "The Greatest Nation"
              b. The SPX broke resistance of 1131
              c. Japanese Markets were closed
              d. The Tea-Party will uproot American Politics
              e. No significant economic data released
              f. I forgot how to take these tests

              The answer is probably a combination of b, c, and e. The S&P finally broke out of its uninspiring trading range on light volume. Though, this may be short lived. Early in the session gold rallied to new highs around 1284. However, these gains were unsustainable. In addition, agricultural commodities, base metals, and Natural Gas led commodities lower. The USD failed to sustain any gains against the Euro, Sterling, 'Aussie', and CHF. Also, the bond market lacked bullish convictions. Alas, capital flowed into equities by default.

              October Nat Gas:1 Month Chart


              December SPX E-mini: 1 Month Chart


              Trades
              We took advantage of the sharp sell-off in December Nat Gas contracts and entered a long position as prices firmed. Also, we are long the Dollar vs. CHF. U.S. Housing Starts come in at 08:30 and The Fed decision is at 14:15 EST. We expect equities to pair some of their gains in tomorrow's session.


              Patrick M. Ambrus
              Twitter: AnalyzeCapital

              Sources: Stockcharts.com, Bloomberg.com, VanityFair

              Wednesday, September 8, 2010

              JPY Trade: Reloaded


              Morpheus: I imagine that right now, you're feeling a bit like Alice. Hmm? Tumbling down the rabbit hole?
              Neo: You could say that.

              --The Matrix


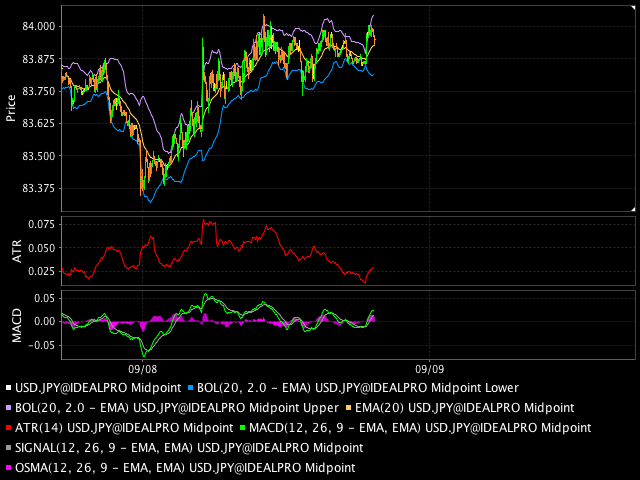
              I do feel a bit like Alice. TheUSD/JPY pair rallied in London and New York trading after selling off in Asian trading. The FX rate established a new 15-year low during the session, trading down to levels of 83.35. I took profits on the pop, during morning U.S. trading, around 84.00 levels. Prices recovered when Finance Minister Yoshihiko Noda 'said he is prepared to take “bold” steps on currencies if necessary.' However, I am contemplating a long position in the Yen until 82.50. I watched the tape for the majority of the past 48 hours (fun times) to get a feel for directionality. I am confident prices will move lower.

              Part of me wants to believe all of this intervention talk, led by PM candidate Ichiro Ozawa, will lead to more 'normalized' price levels (i.e. 88-90). However, my sinister half believes this was a short-covering rally today. In the ten minutes preceding the Beige Book announcement the pair came to an abrupt slow down in trading. Once the words 'decelerated growth' were uttered on CNBC prices gapped down to 83.79-81. During President Obama's 'Economic Speech', shortly thereafter, prices jumped back up to 83.92-95 levels. Hence, U.S. economic speak was not a significant momentum catalyst, net of direction, for the pair.


              JPY 2day chart- 5 minute bars


              Will the tape top out at 84.125 resistance levels? What has changed over the past 48 hours to stunt the momentum of a six month downtrend in the USD/JPY pair? Clearly, many uncertainties and rapid-fire change engulf trading. Thus, I look to a glut of international economic data releases that may potentially impact price directionality:

              19:50- JPY BSI Large Manufacturing Conditions
              01:00- JPY Household Confidence
              02:00- JPY Machine Tool Orders
              02:00- German CPI (MoM)
              04:30- ECB Monthly Report
              07:00- BoE Interest Rate Decision
              08:30- U.S. Trade Balance
              08:30- U.S. Initial Jobless Claims
              19:50- JPY GDP(QoQ)
              19:50 BoJ Monetary Policy Meeting Minutes


              If I have learned one thing in my short few years of trading it is, 'don't trade against the tape.' I will leave you with some wise words from Adam Smith:

              "The chance of gain by every man is more or less overvalued, and the chance of loss is by most men undervalued and by scarce any man who is in tolerable health and spirits valued more than it is worth."

              Patrick M. Ambrus
              Twitter: AnalyzeCapital

              ---------------------------
              USD/JPY = 93.9150 as of 19:37 EST. The 'Matrix' theme for this post was inspired by a fellow trader of mine, Sauros, please view his blog: http://blog.thelordoftrading.com/2010/09/welcome-back-to-real-world-neo.html. Yoshihiko Noda quote was borrowed from Bloomberg.com.

              Tuesday, September 7, 2010

              Japanese Machine Orders


              Japanese machinery orders rose for a second month in July as overseas demand encouraged investment by companies. Orders, an indicator of business investment in three to six months, rose 8.8 percent from June, when they increased 1.6 percent, the Cabinet Office said today in Tokyo. The median forecast of 25 economists surveyed by Bloomberg News was for a 2 percent gain.

              Bloomberg.com


              I am short the JPY at these levels. I expect political instability to derail or at least correct the temporary risk aversion flows into the JPY. The Beige Book tomorrow ought to clarify the FED's stance on 'QE 2.'


              Patrick M. Ambrus
              Twitter: AnalyzeCapital

              Wednesday, September 1, 2010

              Bear Trap or Bull Run?-SPX Update


              Wait and watch. That is where your tape reading comes in, to enable you to decide as to the proper beginning.

              - Larry Livingston, Reminiscences of a Stock Operator

              Unless, you were hiding out in a cave somewhere with Osama Bin Laden watching endless re-runs of President Obama's Oval office adress you probably noticed the huge rally in equity markets yesterday. Many analysts, economists, traders, and journalists attributed the rally to 'robust' PMI data from The People's Republic of China, Europe, and The U.S. Though, ADP employment showed glaring mediocrity in job growth leading up to Non-Farm Payrolls on Friday. Regardless of trailing economic data, the tape tells the true story as always.

              3 Month Daily E-Mini September SPX Chart


              3 Year Daily SPX Chart


              Conclusion:
              1100 is the key price level I'm looking for. If the candles trade above this line I expect a retest of 1130 and maybe a break out to 1150. This must happen in Tomorrow's session though. I fear awful Non-Farm Payroll numbers will allow the shorts to plunge the equity markets once again. The RSI will move up and re-test 60, if it fails to do this, I expect heavier selling-pressure to result. As of writing time, 12:00 EST, Nikkei is up 32.27 points @ 895.29 down significantly from the open. Make it a good trading day.

              Patrick M. Ambrus
              Analyze Capital LLC
              Twitter: AnalyzeCapita

              Monday, August 30, 2010

              The Three Musketeers: USD/JPY, VIX, & SPX

              USD/JPY 6 month Daily Chart


              -I expect to see a retest of 83.75 levels, possibly as low as 83.25
              -The BOJ cannot solely rely on tough talk to weaken the Yen, they must show & prove intervention to the market
              -Momentum and Volatility remain flat; no reason to get long or short until a catalyst appears
              -The 20 day SMA will serve as short-term resistance; 85.75-86.25
              -RSI resistance at 55 levels remains firm
              -Don't discount strong economic data; Unemployment sits at 5.3% and a Current Account Surplus is 3.3% of GDP.

              Trade: I will get long once I see a retest of 83.75 lows. The BOJ will intervene through Quantitative Easing policies in order to allow the exchange rate to bounce to the upside. Once long, I'm looking for 800-1000 pips to the upside.

              ------------

              VIX 6 month Daily


              -200 Day SMA has held as a floor since the 'Flash Crash'
              -The 20 day SMA is about to cross the 50 day
              -RSI is poised to break through 60 and test 70 overbought levels last seen in May
              -Momentum has plenty of room up to 2.5
              -As long as money continues to flow out of Equities into Bonds, volatility will persist

              -----------

              SPX 6 month Daily


              -A head and shoulders reversal pattern is well underway
              -RSI failed at 50 and will go low until it tests oversold territory at 30
              -Momentum topped out and has plenty of room to the downside
              -The 20 day SMA will converge with the 50 day SMA in the next couple of trading sessions
              -The above chart supplements the VIX story
              -This week Consumer Sentiment, China PMI, Euro Zone PMI, U.S. ISM, and NFP take the market sentiment spotlight

              Trade: Short SPX till 1000. Look for short-covering/a relief rally before entry. ES Mini Futures are a great place to start. Also, the ProShares UltraShort S&P500 ETF SDS is another way to double down on your bets.

              -----------

              Related ETFs: ProShares UltraShort S&P500 (SDS), CurrencyShares Japanese Yen Trust (FXY), iShares MSCI Japan Index (EWJ), Consumer Discret Select Sector SPDR (XLY)


              Patrick M. Ambrus
              Analyze Capital LLC
              Twitter: AnalyzeCapital

              Friday, August 27, 2010

              DJIA Update- Charting for Success

              Dow Jones Industrial Average Technical Analysis

              Daily Chart-6 months


              Notes:
              -Momentum still has plenty of room to fall as it just passed break-even territory
              -Resistance appears to be forming at the 50-day SMA or 10,300 level
              -We could see potential support slightly above 9900-9950
              -If this level breaks, Dow could fall to 9300-9500 range, though next clear level of support on the daily chart is 9800
              -Expect to see a retest of 50 on the RSI to confirm a downtrend if the re-test fails
              -The most recent sell-off lacked aptly confirming volume
              -Possibly a head and shoulders reversal pattern


              Weekly Chart- 2 Years


              Notes:

              -Support may come at levels of 9,600-9,700
              -200 day SMA acts as near-term resistance, this equates to a price level of 11,000
              -The last rally to 11,000+ was confirmed by robust volume
              -Momentum still has room to move to the downside, though it looks to be flattening out
              -The 50 day SMA is poised to cross the 200-day SMA, ‘The Golden Cross’, which indicates a strong bullish signal
              -35-37 will need to be broken on the RSI for this down-trend to continue

              Conclusion:

              The Daily and Weekly charts both tell equally convincing stories. The Daily chart indicates very bearish sentiment while the Weekly indicates a potential rally is on the way. Thus, in-lieu of the toss-up, I will look to volume over the next few trading days to indicate which way the tape might be headed. At this time, the Dow is up 151.90 points to 10,137.70. A short-covering rally may be underway, or the bulls may be winning the battle today. Regardless, many bears exist in the market, it is only a matter of time before market participants show their true costumes.


              Patrick M. Ambrus
              Analyze Capital LLC
              Twitter: AnalyzeCapital

              Thursday, August 26, 2010

              Nat Gas Inventories/Trade


              Working gas in storage was 3,052 Bcf as of Friday, August 20, 2010, according to EIA estimates. This represents a net increase of 40 Bcf from the previous week. Stocks were 198 Bcf less than last year at this time and 177 Bcf above the 5-year average of 2,875 Bcf. In the East Region, stocks were 15 Bcf above the 5-year average following net injections of 48 Bcf. Stocks in the Producing Region were 84 Bcf above the 5-year average of 865 Bcf after a net withdrawal of 5 Bcf. Stocks in the West Region were 78 Bcf above the 5-year average after a net drawdown of 3 Bcf. At 3,052 Bcf, total working gas is within the 5-year historical range.

              ir.eia.gov


              This morning I entered a long position in some QG futures. I believe we will see prices move up to 4.00-4.10 before the next pullback. The RSI on the the NG futures remains in oversold territory, and momentum is bottoming. In addition, The UNG confirms a similar trading trend in the RSI and MACD. Also, I expect the 20 day SMA to cross the 50 day. Prices are already bouncing back from the inventory data release.

              Patrick M. Ambrus
              Analyze Capital LLC
              Twitter: Analyze Capital

              Tuesday, August 24, 2010

              勝利 x 2


              'I'm on a losing strike, I mean winning streak'

              -Wasalu Muhammad Jaco

              Today I made one of my best trades of this scorching summer. After a glut of discussion on M & A activity, economic data, trade flows, credit flows, and Technical analysis, the lords of trading spoke to me. I was fortunate in my timing because many times a bad entry point can ruin your trade.

              Catalysts

              The bond markets continue to rally as yields on 10 year government notes tighten to levels reminiscent of the Credit Crisis. Similarly, the USD has not been kind to commodities or U.S. equity markets. Lastly, poor expectations for Existing home sales data and GDP revision data sealed bearish sentiment.

              Please view Alex's SPX update below for more in-depth technical analysis.


              Related ETFs: CurrencyShares Euro Trust (NYSEArca:FXE), CurrencyShares Japanese Yen Trust (NYSEArca: FXY), ProShares Ultra S&P500 (NYSEArca: SSO)

              Literature: Friedrish Engels, The Origins of the Family, Private Property and the State

              Sports: The New York Jets and All-Pro center Nick Mangold have agreed on a new seven-year deal worth a maximum of $55 million.


              Patrick M. Ambrus
              Analyze Capital LLC
              Twitter: AnalyzeCapital

              Thursday, August 19, 2010

              Jobless Claims, Philadelphia FED Survey, & ES Trade


              Jobless Claims
              Initial claims are piling up, indicating that businesses are continuing to cut costs. Initial claims came in at 500,000 in the August 14 week for the largest total since November. The four-week average of 482,500 is the largest since December. A month-to-month look shows significant deterioration of 25,000 for a percentage change of nearly six percent. The Labor Department said special factors are playing no part in the data

              Philly FED Survey
              Manufacturing indications out of the Mid-Atlantic region are decidedly negative for August. The Philadelphia Fed's general business conditions index fell to minus 7.7 to indicate month-to-month contraction in business activity. New orders, at minus 7.1, show a second straight monthly decline in what is a definitive indication of weakness. Unfilled orders extended a run of declines. Shipments also fell in the month as did employment and the workweek. Inventories also fell while delivery times quickened

              Bloomberg.com


              My ES SPX short finally paid off today. The futures activity was timid before the open. However, the Philly Fed survey sealed the deal for me. Currently, I'm surveying the ES chart for reentry points to short again. In addition, I hold some USO options. I'll keep you posted on that when I make up my mind. Until then, I'll enjoy this one.

              Related ETFs: ProShares Ultra S&P500 (SSO:US), iShares Russell 2000 Value Index Fund (IWN:US), ProShares UltraShort S&P500 (SDS:US)

              Sports: Carmelo Anthony wants to play in New York as a Knick.

              Patrick M. Ambrus
              Analyze Capital LLC
              Twitter: AnalyzeCapital

              Wednesday, August 4, 2010

              EIA Oil Inventories & SPX Trade


              EIA Data
              U.S. crude oil refinery inputs averaged 15.6 million barrels per day during the week ending July 30, 113 thousand barrels per day above the previous week’s average. Refineries operated at 91.2 percent of their operable capacity last week. Gasoline production decreased last week, averaging 9.4 million barrels per day. Distillate fuel production increased slightly last week, averaging 4.4 million barrels per day.

              U.S. crude oil imports averaged 9.6 million barrels per day last week, down by 1.5 million barrels per day from the previous week. Over the last four weeks, crude oil imports have averaged 10.0 million barrels per day, 494 thousand barrels per day above the same four-week period last year. Total motor gasoline imports (including both finished gasoline and gasoline blending components) last week averaged 1.2 million barrels per day. Distillate fuel imports averaged 187 thousand barrels per day last week.

              Energy Information Agency


              SPX Trade
              Yesterday I entered a short position on some SPX E-mini futures. Today I was stopped at around 1125. This was a poor trade overall. I mistimed my entry point. From here my trade unravelled. However, I maintained discipline and did not get emotional. Sometimes you learn more about trading from losers than winners. Although, I did have that 30 point gainer last week, so I should not be too disappointed. Overall, I need to re-evaluate my thoughts on the SPX going forward (short-term movements). The lack of volatility in this market cramps my trading style.

              Related ETFs:ProShares UltraShort S&P500 (SDS:US), Consumer Discretionary Select Sector SPDR Fund (XLY:US), Oil Services Holders Trust (OIH:US)


              Books: Ken Rogoff and Carmen Reinhart's This Time is DIfferent gives great insight into the relationships of banking crises, sovereign defaults, inflation, unemployment, stock market crashes, and currency crises.

              Sports: The Diesel to Bean Town. Good move for both parties.

              Patrick M. Ambrus
              Analyze Capital LLC
              Twitter: AnalyzeCapital

              Monday, August 2, 2010

              ISM Manufacturing, China PMI, & an SPX Trade


              ISM Data
              New orders slowed abruptly in July, in what is the key headline of the Institute For Supply Management report. New orders fell to 53.5, still above 50 to indicate month-to-month growth but down five points from June to indicate a significantly slower rate of growth. The 53.5 reading is the lowest since the manufacturing sector emerged from recession this time last year. Backlog orders also slowed, to 54.5 for a 2-1/2 point decline and its lowest reading since December.

              China PMI
              A purchasing managers’ index released today by HSBC Holdings Plc and Markit Economics slid to 49.4 from 50.4 in June. A separate, government-backed PMI fell to 51.2 from 52.1, the Federation of Logistics and Purchasing reported yesterday. Fifty is the dividing line between expansion and contraction.

              Bloomberg.com


              Trade
              Around 09:30 EST I decided to go long some SPX E-mini Futures. The inspiration came last night. Before bed I performed various Synthesis and Analysis of China PMI data coupled with quotes from the Global debt market before bedtime. Sentiment pointed toward a rally in equities. In addition, The German Xetra Dax was up over 2% before U.S. equity trading opened. Confirmation, or so I surmised. Hence, I made a quick play and will wait for more catalysts to reveal themselves.

              Related ETFs: iShares FTSE/Xinhua China 25 Index Fund (FXI:US), Materials Select Sector SPDR Fund (XLB:US), iShares Dow Jones Transportation Average Index Fund (IYT:US)

              Music Selection: I saw Nas & Damian Marley perform in Brooklyn on Saturday. Positive music with a powerful message. My favorite track is leaders.

              Sports: Unfortunately, NY Jets Defender Darrelle Revis wants more money. I can't blame the guy. He is the best Cornerback in the game and the backbone of our defense. We need him back.


              Patrick M. Ambrus
              Analyze Capital LLC
              Twitter: Analyze Capital

              Friday, July 30, 2010

              Gross Domestic Product


              GDP = Consumption + Foreign Direct Investment + Government Expenditures + Net Exports

              Second quarter GDP came in at an annualized 2.4 percent growth, following a revised first quarter gain of 3.7 percent. Today's release includes annual revisions going back three years. The second quarter advance estimate is just barely below analysts' projections for a 2.5 percent increase. But the first quarter upward revision of a full percentage point from the prior estimate of 2.7 percent is a positive surprise.

              The latest quarter was led by a rebound in residential investment, a jump in investment in equipment & software, and by inventories. PCEs also posted a moderate gain along with government purchases. The big negative is a worsening in net exports.

              Bloomberg.com


              Equities tanked early in the trading session, but managed to eke out minimal gains by the close. I did not execute any trades today. However, I simulated some options trades with GLD and SLV. Needless to say, the new strategies look good. Look for M&A news on Sunday to boost equities on Monday morning. Have a great weekend!

              Patrick M. Ambrus
              Analyze Capital LLC
              Twitter: Analyze Capital
               
              Disclaimer
              This Blog has been developed by Analyze Capital LLC, and as an independent organization we provide “AS IS” information without warranty. The ideas and opinions expressed by the contributers of this blog are personal and do not represent the actions or policies of Analyze Capital LLC. The contents of this blog do not intend to assert recommendations or to offer advice of any kind. We are not responsible the consequences, be they gains or losses, that may result from using any of the information from this blog.