rss
email
twitter
facebook
Showing posts with label Natural Gas. Show all posts

Wednesday, September 29, 2010

Navigating Global Capital Markets


Trading FX is right now is like navigating the Amazon River, 'Grey Swans from Extremistan' lurk around every land mass..... As the often quoted John Maynard Keynes once advised, "The market can stay irrational longer than you can stay solvent."
    Credit Default Swaps on Irish, Portuguese, Greek, and Spanish Debt continue to widen. Anglo Irish debt was downgraded by Moody's on Monday and now needs another lifeline of 5B Euros.  Yet, the Euro continues to strengthen.  Mr. Bernanke and Mr. Obama must be smoking a fine Cuban cigar at the moment because they are the only 2 policy makers of recent memory to weaken their currency without  significant lip service.  The Japanese MOF should take the lesson...start a trade war with China and watch your currency tank...There is much fear in holding US Dollars at the moment.  Mr. Guido Mantega of Brazil is right, we do have a full fledged currency war of devaluation and the U.S. is winning.
      Also of note, Mr. Yu Yongding an advisor to The People's Bank of China spoke in Singapore  of a full fledged dollar crisis, to quote the man, "Such a huge amount of debt is terrible and the situation will be worsening day by day.  I think we are one step nearer to a US Dollar crisis."  Cheers to you too mate.
        This morning AUD is off its highs of .9780 levels seen in Tokyo trading overnight and has pulled back toward .9700 levels.The AUD continues to test new highs as it inches towards parrity with the USD and makes new highs against the JPY.  Though, the latter has internal economic issues of its own which continue to put downward pressure on any of the Yen's major pairs.  The appreciation in large is due to sustained demand for Australian base/industrial metals from China and ASEAN countries in general.  Also, Australia maintains the highest nominal interest rates, currently at 4.5%, of any G20 country and thus is perfect for a reverse carry trade involving the USD.  Ironic how times have changed.  I can remember the days when U.S. assets became the beneficiary of an Asia Pacific carry trade.  And then we had a realestate market collapse in correlation with all other asset classes for that matter....Low rates, continued AUD strength!
          Meanwhile, the only commodities that want to rally are precious metals...Agri commodities crashed like the titantic yesterday and continue to hit icebergs today.   This is possibly due to the recent sanctions China placed on imported U.S. Chickens.  Chickens love grains as a main source of their diets.  Also, the recent run-up in Agri prices does justify a correction if prices are to move higher in the 4th Quarter.  Natural Gas is trading lower and Oil cannot hold on to any incremental gains.  Though API data from last night was somewhat bullish, and DOE data should help prices firm a bit, but their is no support in sight. Nat Gas is suffering from a lack of supply scarcity.  In fact new inventories appear every day and remain above our famous 5 year average range.  Yet, this makes little sense considering storage capacity and new LNG technologies make storage and shipment of the energy easier and cheaper than ever. I will note that Sugar, Cocoa, and Coffee performed well in yesterdays session largely attributed to you guessed it, dollar weakness.
            Bill Gross published a grim outlook in his October outlook letter.  He highlighted Stan Drunkenmiller's retirement as a Harbinger of things to come in the fund management industry.  He argues that the days of double digit returns are over due to a lack of asset inflation, increased regulation, and deregulation.  Indeed these things are all true.  One must take Mr. Gross' comments with a grain of salt as he manages the world's largest bond fund in PIMCO.  His comments do coincide with a 10% workforce reduction at DE Shaw, one the world's largest Hedge Funds with approximately $21 B of assets under management.  HF's are struggling to produce alpha these days.  According to HFN Hedge Fund Aggregate Index funds are up only 0.14% YTD through June 2010.  The FT reports Hedge funds are up 1.45% YTD.  Times are grim when the best managers of money can't make a buck.
              It is understandable that there is an underlying current of fear surrounding the developed markets of the world.  Emerging Markets were thrust into the spotlight during the most morbid of days during the credit crisis and have been in the spotlight since.  OECD economies continued to point to Emerging Market Demand and growth as the way of the future and how this shift is a 'structural' one that will change the way the global markets do business.  All I can say is, not so fast jack.  Without demand for emerging market exports from developed economies there will be no new growth.  Unless of course the ubiquitous Emerging Markets can create a sustainably contempory domestic demand system for domestically produced goods.  I doubt Malaysia needs all those those textiles and garments they continue to churn out.

              Undoubtedly, big corporates still reside in developed markets.  Inventories have refilled after bone dry levels spawned a rampant increase in production over the last 2 quarters.  Thus, unless OECD demand returns to the global marketplace, emerging markets will not be able to maintain their 'robust' growth systems and will inevitably slow down.  Global 'Austerity' is in order.  We should all trade accordingly.

              Patrick M. Ambrus
              Contact: analyzecapital@gmail.com

              Sources: Financial Times, The Gartman Letter, Bloomberg.com, HFN.com, The Black Swan, PIMCO.com

              Thursday, September 23, 2010

              Buoyant Natural Gas


              EIA Data release for week ending September 17, 2010:


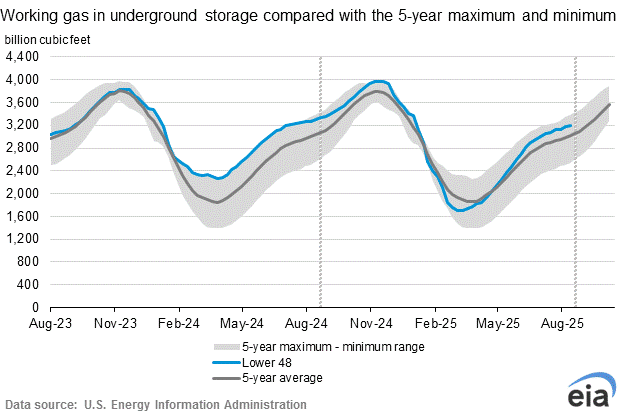
              Working gas in storage was 3,340 Bcf as of Friday, September 17, 2010, according to EIA estimates. This represents a net increase of 73 Bcf from the previous week. Stocks were 175 Bcf less than last year at this time and 195 Bcf above the 5-year average of 3,145 Bcf. In the East Region, stocks were 16 Bcf above the 5-year average following net injections of 53 Bcf. Stocks in the Producing Region were 114 Bcf above the 5-year average of 915 Bcf after a net injection of 19 Bcf. Stocks in the West Region were 65 Bcf above the 5-year average after a net addition of 1 Bcf. At 3,340 Bcf, total working gas is within the 5-year historical range.


              Price Data


              Headwinds

              A significant portion in achieving upward price momentum has been unpredictably moderate temperatures. We are in an environment in which Nat Gas is not needed for cooling nor for heating. Additionally, Hurricane season has yet to come to fruition (that is an oxymoron but rings some truth for an energy trader) and will likely continue upon its uneventful season. However, hope remains in the form of tropical storm Lisa. WIth warmer temperatures in the Atlantic, the potential for greater velocity of headwinds and illustrious destruction increases rapidly; think Hurricane Rita. If the storm hits the North East, I would look for Philadelphia output to stagnate.

              Tailwinds

              We'd like to see the November contracts find support at $4.15/mmBtu. Though the contangion spread between November/December contracts (.216) is much wider than that of December/January (.1620). A scenario could develop in which the November/December spread widens until demand firms for the near-month contracts. Otherwise, spreads should narrow as the near month November contracts gain demand traction. We expect to see sustainable support of $3.98 on October contracts expiring on Tuesday.

              December NG: 3-Month Daily Chart


              Trade

              As Alex astutely alluded to yesterday, we are long MINY December Contracts. We will look to'pyramid' once prices move into a tighter range at higher price levels, if there is such a thing.

              Patrick M. Ambrus
              Twitter: AnalyzeCapital

              Source: http://ir.eia.gov/ngs/ngs.html

              Thursday, August 26, 2010

              Nat Gas Inventories/Trade


              Working gas in storage was 3,052 Bcf as of Friday, August 20, 2010, according to EIA estimates. This represents a net increase of 40 Bcf from the previous week. Stocks were 198 Bcf less than last year at this time and 177 Bcf above the 5-year average of 2,875 Bcf. In the East Region, stocks were 15 Bcf above the 5-year average following net injections of 48 Bcf. Stocks in the Producing Region were 84 Bcf above the 5-year average of 865 Bcf after a net withdrawal of 5 Bcf. Stocks in the West Region were 78 Bcf above the 5-year average after a net drawdown of 3 Bcf. At 3,052 Bcf, total working gas is within the 5-year historical range.

              ir.eia.gov


              This morning I entered a long position in some QG futures. I believe we will see prices move up to 4.00-4.10 before the next pullback. The RSI on the the NG futures remains in oversold territory, and momentum is bottoming. In addition, The UNG confirms a similar trading trend in the RSI and MACD. Also, I expect the 20 day SMA to cross the 50 day. Prices are already bouncing back from the inventory data release.

              Patrick M. Ambrus
              Analyze Capital LLC
              Twitter: Analyze Capital

              Tuesday, July 13, 2010

              Jesse Livermore/Natural Gas Update- 07.13.2010


              And the Magic number is? $4.35. If we see a clean break below this level I expect NG to test the next levels of support at $4.15. Volume confirmation is key. Prices have traded in a narrow range the past four days due to "forecasts of moderate temperatures in the U.S. Midwest and Northeast later this month," according to commodityonline.com.

              On a positive note, the 50 day SMA looks to be converging with the 100 day SMA. Couple this with strong Supply and Demand Data and we should see a clean retest of $4.50. I will be looking for a decrease in supplies, in-ine or below estimates. Until then I will sit, wait, and hope I do not get stopped out.

              "There is only one way to achieve success in speculation--through hard work, persistently hard work. If there is any easy money lying around, no one is going to try and give it to me, this I know."

              --Jesse Livermore, World's Greatest Stock Trader

              Monday, July 12, 2010

              Nat Gas Update


              Unfortunately, my position was stuck in the mud all day. NG contracts for August delivery reached a high, mid-morning EST, of close to $4.445/mmBtus. I entered at $4.45. Tonight I will watch GLOBEX trading and re-evaluate my position before NYMEX trading opens tomorrow morning. Currently prices are hovering around $4.388.

              To hold it upright and fill it, is not so good as stopping in time. When you pound it out and give it a point, It won't be preserved very long. When gold and jade fill your rooms, you'll never be able to protect them. Arrogance and pride with their wealth and rank, on their way bring disaster. When the deed is accomplished you retire; Such is Heaven's way.

              --Lao-Tzu, Chapter 91


              Patrick M. Ambrus
              Analyze Capital LLC

              Thursday, July 8, 2010

              Nat Gas Inventories/Trade


              Natural gas in storage rose 78 billion cubic feet in the latest week. An injection of 70 bcf was expected.

              Bloomberg.com


              As one can see from the chart, I purchased some August NG contracts on the the oversupply news. My stops are set around 4.35. Though, I expect to ride this trade out over the next day and half. My price target is $4.53/MMBtu. I will keep you updated on any new developments.

              Patrick M. Ambrus
              Analyze Capital LLC
              analyzecapital@gmail.com

              Wednesday, June 23, 2010

              Market Update-06.23.2010


              Equity Indexes
              INDU- 10298.40 4.92 (+0.05%)
              NASDAQ- 2254.23 -7.57 (-0.33%)
              SPX- 1092.04 -3.27 (-0.30%)

              Commodities
              WTI Crude Oil- $76.14 -0.21 (-0.28%)
              Brent Crude Oil- $76.270 -1.770 (-2.27%)
              Natural Gas- $4.7990 -0.005 (-0.10%)
              Gold Spot- $1238.00 3.20 (+0.26%)
              Silver Spot- $18.585 0.081 (+0.44%)

              Bonds
              2 Year UST- Price:99.89 (-0.02) Yield: 0.68% (+0.68)
              10 Year UST- Price:103.20 (-0.02) Yield: 3.12% (-0.05)
              10 Year Gilt- Price:110.75 (+0.17) Yield: 3.43% (-0.02)
              10 Year Bund- Price:103.05 (+0.39) Yield: 2.64% (-0.04)
              10 Year Oats- Price:103.51 (-0.11) Yield: 3.08% (+0.01)
              10 Year JGB- Price:101.32 (+0.12) Yield: 1.15% (-0.04)
              10 Year Greek- Price: 74.97 (-2.91) Yield: 10.36% (+0.59)

              Foreign Exchange
              EUR/USD = 1.2313
              GBP/USD = 1.4973
              USD/JPY = 89.9340
              USD/CAD= 1.0394
              EUR/JPY = 111.1698
              EUR/HUF= 279.5028

              Equity Index Futures
              Nikkei 225- 9,950.00 +50.00
              Hang Sang- 20,935.00 +96.00
              SPI 200- 4,481.00 +8.00

              10 year Greek debt is now trading at a whopping 772 bp over 10 year Bunds. It will be nearly impossible for the Greek government to roll over their debt in private markets or access short-term financing for their day-to-day operations, if spreads continue to widen. Unfortunately this story did not get enough play today.

              The U.S. economy was front and center. Bernanke reminded us he and his team can continue to drop money out of the FED's helicopter if needed. Kansas City President Hoening was the lone dissenter today.

              I took some profits on my SPX puts early in the session today. Tomorrow I'm looking to go long Nat Gas for part of the session. Crude is in play too.

              By the way, All Kobe does is win! Good luck trading tomorrow!

              Related ETF's: United States Oil Fund LP (USO:US), United States Natural Gas Fund LP (UNG:US), United States 12 Month Natural Gas Fund LP (UNL:US)

              Patrick M. Ambrus
              Analyze Capital LLC
              ambrus.anlzgroup@gmail.com

              Thursday, March 4, 2010

              Going in for the Kill- 03.04.2010


              Well it looks like my timing on entry into the UNG was a bit off. I failed to correctly forecast the Nat Gas inventory reports this morning as they declined less then expected (see morning updates ). Domestic production, specifically supplies from unconventional gas fields such as the Marcellus Shale in the Northeast/Appalachia region and the Haynesville Shale in Louisiana, has not declined substantially despite reductions in overall rig counts compared with this time last year. Natural Gas sold off hard and UNG has touched a low of $8.25. However, I stand by my thesis.

              Logic

              Fundamentals

              •Seasonality has beaten it up this winter while we have had warmer than expected temperatures in the Midwestern United States.

              •As of Friday, February 26, working gas in underground storage was 1,737 billion cubic feet (Bcf), which is 1.2 percent above the 5-year (2005-2009) average. The implied net withdrawal from storage was 116 Bcf.


              Technicals

              •Since September the RSI is in a Bullish trend forming higher highs after a bounce off of support at 30 or so.

              •The 50 day Simple Moving Average will act as near term resistance.

              Conclusion:
              Hence, the tape should carry me to about 9.25-9.50 before I have to make a decision.


              Patrick M. Ambrus
              Managing Partner
              Analyze Capital LLC
              ambrus.anlzgroup@gmail.com

              Morning Updates- 03.04.2010


              Good Morning fellow market junkies. Today there is a glut of economic data that should and could potentially give the equity markets some type of direction. Today we will see interest rate decisions from BOE and ECB. I will be looking for any type of details on winding down QE programs. Hence, I want to know when liquidity will start to drain from the system. Also, I want to hear ECB commentary on the sovereign debt problems in Greece and elsewhere. Trichet will probably speak to these issues specifically.

              Other Notable Economic Data today:

              •05:00 Euro Zone GDP (QoQ)

              •08:30 ECB President Jean-Claude Trichet Speaks

              •08:30 U.S. Initial Jobless Claims- Forecast (475,000 lost)

              •08:30 U.S. Nonfarm Productivity (QoQ)- Forecast 6.2%

              •10:00 Canadian Ivey PMI- Forecast 55.00

              •10:00 U.S. Pending Home Sales- Forecast 1.7%

              •10:30 U.S. EIA Natural Gas Report


              BOE Rate Decision

              The Bank of England’s Monetary Policy Committee today voted to maintain the official Bank Rate paid on commercial bank reserves at 0.5%. The Committee also voted to maintain the stock of asset purchases financed by the issuance of central bank reserves at £200 billion.


              Not too much of a surprise here. Minutes will be released on March 17th.


              ECB Rate Decision (Update1)

              At today’s meeting the Governing Council of the ECB decided that the interest rate on the main refinancing operations and the interest rates on the marginal lending facility and the deposit facility will remain unchanged at 1.00%, 1.75% and 0.25% respectively.

              The President of the ECB will comment on the considerations underlying these decisions at a press conference starting at 08.30 EST today.


              I am waiting for some clarity from Trichet before I digest.

              Update:

              link to full Trichet opening comments: http://www.ecb.int/press/pressconf/2010/html/is100304.en.html


              Euro Zone GDP

              GDP increased by 0.1% in both the euro area1 (EA16) and the EU271 during the fourth quarter of 2009, compared with the previous quarter, according to first estimates released by Eurostat, the statistical office of the European Union. In the third quarter of 2009, growth rates were +0.4% in the euro area and +0.3% in the EU27.

              Compared with the fourth quarter of 2008, seasonally adjusted GDP declined by 2.1% in the euro area and by 2.3% in the EU27, after -4.1% and -4.3% respectively for the previous quarter.


              GDP was the weakest in Latvia (-3.2%) and Romania (-1.5%). Estonia had the most robust growth (+2.6%).
              Full details: http://epp.eurostat.ec.europa.eu/portal/page/portal/eurostat/home/

              U.S. Jobless Claims (update 2)

              In the week ending Feb. 27, the advance figure for seasonally adjusted initial claims was 469,000, a decrease of 29,000 from the previous week's revised figure of 498,000. The 4-week moving average was 470,750, a decrease of 3,500 from the previous week's revised average of 474,250.

              U.S. Non-Farm Productivity (QoQ) (update 4)

              Both productivity and costs were revised better than expected for the fourth quarter. Businesses clearly are focusing on cutting labor costs to try to boost profits or cut losses. Nonfarm business productivity was revised up to a sharp 6.9 percent boost from the initial estimate of 6.2 percent. This followed a revised 7.8 percent surge in the third quarter. Today's report includes annual revisions which raised the Q3 figure. The consensus had called for a 6.3 percent revised gain for the latest period. Unit labor costs fell an annualized 5.9 percent in the fourth quarter, compared to an initial estimate of minus 4.4 percent and a revised third quarter plunge of 7.6 percent. The market forecast was for a 4.5 percent drop in costs.

              U.S. Pending Home Sales Index (Update5)

              The Pending Home Sales Index,* a forward-looking indicator based on contracts signed in January, fell 7.6 percent to 90.4 from an upwardly revised 97.8 in December, but remains 12.3 percent higher than January 2009 when it was 80.5.

              Lawrence Yun, NAR chief economist, said weather is likely to impact housing data. “January pending sales, though still higher than one year ago, remain much lower than expected given that a large number of potential buyers are eligible for the expanded home buyer tax credit. Moreover, the abnormally severe and prolonged winter weather, which affected large regions of the U.S., hampered shopping activity in February,” he said.


              Nat Gas Inventories (Update 7 last one)
              Working gas in storage was 1,737 Bcf as of Friday, February 26, 2010, according to EIA estimates. This represents a net decline of 116 Bcf from the previous week. Stocks were 71 Bcf less than last year at this time and 21 Bcf above the 5-year average of 1,716 Bcf. In the East Region, stocks were 9 Bcf below the 5-year average following net withdrawals of 74 Bcf. Stocks in the Producing Region were 24 Bcf below the 5-year average of 604 Bcf after a net withdrawal of 27 Bcf. Stocks in the West Region were 54 Bcf above the 5-year average after a net drawdown of 15 Bcf. At 1,737 Bcf, total working gas is within the 5-year historical range.

              Natural Gas sold off after this report was released.


              Quotes

              Foreign Exchange
              -EUR is down -0.2775% against the USD @ $1.3657 as of 9:36 EST.
              -EUR is up 0.4666% against the JPY at 121.66.
              -USD is strengthening against the JPY by 0.6327% @ 89.0650.
              -GBP is up against the USD by 17 basis point at $1.5124.

              Commodities
              -Gold is down $3.70 sitting at 1139.00/troy ounce
              -Silver is off 37 bp @ $17.265/t oz.
              -WTI Crude is down $0.56 this morning to $80.31/barrel
              -Nat Gas is down @ $4.72/MMbtu

              Equities

              Asia (closed)
              -Nikkei 225- off -1.05% @ 10,145.72
              -Topix- down 8.01 points to 897.64
              -Hang Sang- off -1.44% to 20,575.78
              -S&P/ASX 200- down 14.80 point @ 4750.50
              -CSI 300- down 84.51 points to 3250.57

              Europe
              -FTSE 100- 5521.31 off -.22%
              -CAC 40- 3833.06 down -.25%
              -DAX 30- negative by 21.40 points @ 5796.48

              United States
              -Dow Jones- up 25.32 points @ 10,422.08 (as of 09:30 EST)
              -NASDAQ- up .14% @ 2283.94
              -s&P 500- up 2.9% to 1121.99


              Bonds
              -UST 10 Y- Price: off .035 to sit at 99 30/32 Yield: 3.63%
              -Bunds 10 Y- Price: off .047 to 100.89 Yield: 3.14%
              -JGB 10 Y- Price: rallied .044 to 100.57 Yield: 1.34%


              I will try and Update this throughout the trading day

              Good luck trading


              Patrick M. Ambrus
              Managing Partner
              Analyze Capital LLC
              ambrus.anlzgroup.gmail.com

              Wednesday, March 3, 2010

              Nat Gas Trade- 03.03.2010


              This Morning I entered into a long UNG position. I had been day trading the stuffing out of this ETF for a while but I took a break to re-evaluate fundamentals and technicals. Alas, I feel the UNG will bounce off of long-term support. I will ride this baby as far as she takes me. More on this trade to come in the future; stay tuned.

              "Do you know why Fund Managers can never beat the S&P 500? They're sheep and sheep get slaughtered."

              --Gekko


              Patrick M. Ambrus
              Managing Partner
              Analyze Capital LLC
              ambrus.anlzgroup@gmail.com
               
              Disclaimer
              This Blog has been developed by Analyze Capital LLC, and as an independent organization we provide “AS IS” information without warranty. The ideas and opinions expressed by the contributers of this blog are personal and do not represent the actions or policies of Analyze Capital LLC. The contents of this blog do not intend to assert recommendations or to offer advice of any kind. We are not responsible the consequences, be they gains or losses, that may result from using any of the information from this blog.