rss
email
twitter
facebook

Monday, September 13, 2010

Ripe for a Short


Today the SPX rallied and finished up 1.15% to 1122.29 above the 200 Day Simple Moving Average. The rally was in large part driven by 'robust' Industrial Production and domestic demand data released by China over the weekend. The Energy and Materials sectors led the SPX higher today. WTI Oil was up over 1% on the session to $77.20. Copper and Natural Gas also benefitted from the rally.

GSCI Commodity Index


Last night Basel III capital requirements released and were essentially a practical joke on banks. Banks will be required to maintain a Tier 1 Capital ratio of 4.5% (common equity after deductions) and a buffer of 2.0% by 2013. Keep in mind, Lehman had a Tier 1 Capital ratio of 11% when the investment bank imploded. So much for stringent regulation. Needless to say, financials rallied hard on the session.

SPX 1 Year Daily


VIX


Where do equities go from here? 1131 is the next key level of resistance on the SPX. Tomorrow U.S. retail sales release at 08:30 and disappointing numbers could be the impetus to drive equities lower. In addition, we are approaching overbought technical levels on the RSI (62 on the 1 year daily). In addition, the VIX traded down around 21 today. The volatility index is ripe for a pop up to 23 to 24 over the next few sessions. Thus, now may be the time to get get short the SPX.


Sports: Jets vs. Ravens tonight. Gang Green will be victorious.

Patrick M. Ambrus
Twitter: AnalyzeCapital

Sources: Bloomberg.com, FT Alphaville, TheLordofTrading.com, baseliii-accord.com

Thursday, September 9, 2010

Black Gold


But eventually it's a question of access: Getting access to fields is on top of the oil companies' agenda. We see a substantial build-up of supply occurring over the coming years.

-Daniel Yergin


WTI Crude Oil traded higher up to $75.95/barrel during the morning session. However the commodity pulled back when the EIA data was released. The October contract currently trades at $74.10 Below, I compiled some of the key EIA data for your own synthesis & analysis.


Price Pressure
Why has CL1 traded in a range for the past month? There is a large contagion gap between the near month October Futures contracts and the November Contracts of 2.04%. As settlement date approaches, November prices will fall. In addition, supply levels in Kuching Oklahoma remain above historical levels for this time of year.

Macro View
Growth numbers out of China have been less than stellar. China PMI data was up only .5% from July to 51.7%, HSBC numbers were below 50. Also, the 'Deflation Story' in the U.S. and Japan will not help the perception of commodities. As money continues to flow into the bond market inflationary investments become less attractive. Lastly, there has been less conflict in the Middle East than normal. Thus, OPEC sour-crude supply is not in danger of shortages in the near-term.

Highlights from EIA Report


-U.S. crude oil imports averaged 8.9 million barrels per day last week, down by 794 thousand barrels per day from the previous week.
-Over the last four weeks, crude oil imports have averaged 9.5 million barrels per day, 500 thousand barrels per day above the same four-week period last year.
-U.S. commercial crude oil inventories (excluding those in the Strategic Petroleum Reserve) decreased by 1.9 million barrels from the previous week.
-At 359.9 million barrels, U.S. crude oil inventories are above the upper limit of the average range for this time of year
-Distillate fuel inventories decreased by 0.4 million barrels, and are above the upper boundary of the average range for this time of year.
-Total products supplied over the last four-week period has averaged 19.6 million barrels per day, up by 0.7 percent compared to the similar period last year
-Jet fuel demand is 0.8 percent lower over the last four weeks compared to the same four- week period last year.
-During June and July of 2010, the Gulf oil producing region was impacted by two storms: Alex and Bonnie shut in a cumulative total of about 1.6 million barrels of crude oil production.


Patrick M. Ambrus
Twitter: AnalyzeCapital

Empirical data is courtesy of eia.gov

Wednesday, September 8, 2010

JPY Trade: Reloaded


Morpheus: I imagine that right now, you're feeling a bit like Alice. Hmm? Tumbling down the rabbit hole?
Neo: You could say that.

--The Matrix


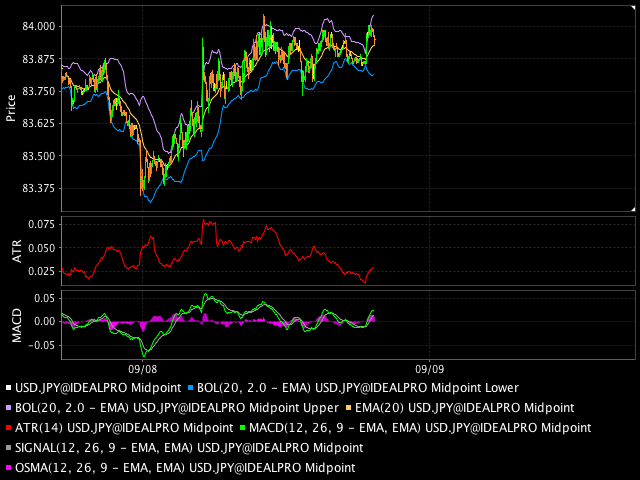
I do feel a bit like Alice. TheUSD/JPY pair rallied in London and New York trading after selling off in Asian trading. The FX rate established a new 15-year low during the session, trading down to levels of 83.35. I took profits on the pop, during morning U.S. trading, around 84.00 levels. Prices recovered when Finance Minister Yoshihiko Noda 'said he is prepared to take “bold” steps on currencies if necessary.' However, I am contemplating a long position in the Yen until 82.50. I watched the tape for the majority of the past 48 hours (fun times) to get a feel for directionality. I am confident prices will move lower.

Part of me wants to believe all of this intervention talk, led by PM candidate Ichiro Ozawa, will lead to more 'normalized' price levels (i.e. 88-90). However, my sinister half believes this was a short-covering rally today. In the ten minutes preceding the Beige Book announcement the pair came to an abrupt slow down in trading. Once the words 'decelerated growth' were uttered on CNBC prices gapped down to 83.79-81. During President Obama's 'Economic Speech', shortly thereafter, prices jumped back up to 83.92-95 levels. Hence, U.S. economic speak was not a significant momentum catalyst, net of direction, for the pair.


JPY 2day chart- 5 minute bars


Will the tape top out at 84.125 resistance levels? What has changed over the past 48 hours to stunt the momentum of a six month downtrend in the USD/JPY pair? Clearly, many uncertainties and rapid-fire change engulf trading. Thus, I look to a glut of international economic data releases that may potentially impact price directionality:

19:50- JPY BSI Large Manufacturing Conditions
01:00- JPY Household Confidence
02:00- JPY Machine Tool Orders
02:00- German CPI (MoM)
04:30- ECB Monthly Report
07:00- BoE Interest Rate Decision
08:30- U.S. Trade Balance
08:30- U.S. Initial Jobless Claims
19:50- JPY GDP(QoQ)
19:50 BoJ Monetary Policy Meeting Minutes


If I have learned one thing in my short few years of trading it is, 'don't trade against the tape.' I will leave you with some wise words from Adam Smith:

"The chance of gain by every man is more or less overvalued, and the chance of loss is by most men undervalued and by scarce any man who is in tolerable health and spirits valued more than it is worth."

Patrick M. Ambrus
Twitter: AnalyzeCapital

---------------------------
USD/JPY = 93.9150 as of 19:37 EST. The 'Matrix' theme for this post was inspired by a fellow trader of mine, Sauros, please view his blog: http://blog.thelordoftrading.com/2010/09/welcome-back-to-real-world-neo.html. Yoshihiko Noda quote was borrowed from Bloomberg.com.

Tuesday, September 7, 2010

Japanese Machine Orders


Japanese machinery orders rose for a second month in July as overseas demand encouraged investment by companies. Orders, an indicator of business investment in three to six months, rose 8.8 percent from June, when they increased 1.6 percent, the Cabinet Office said today in Tokyo. The median forecast of 25 economists surveyed by Bloomberg News was for a 2 percent gain.

Bloomberg.com


I am short the JPY at these levels. I expect political instability to derail or at least correct the temporary risk aversion flows into the JPY. The Beige Book tomorrow ought to clarify the FED's stance on 'QE 2.'


Patrick M. Ambrus
Twitter: AnalyzeCapital

Thursday, September 2, 2010

FX Briefing

The USD/JPY pair is yet to break out of its trading range established during the last 2 sessions between 84.00-to about 84.50. I'm still waiting for an entry around 83.75. I expect Non-Farm Payrolls to drive the pair lower in early trading tomorrow morning.

On another note, the EUR/USD pair is up marginally sitting at 1.2815. I'm looking for a rally to the 1.2950 levels before I get long. The Dollar Index is flat on the session pairing early morning declines.


'The US Dollar Index includes the exchange rates of the following six currencies: euro (EUR), Japenese yen (JPY), Pound sterling (GBP), Canadian dollar (CAN), Swedish krona (SEK), and Swiss franc (CHF).'

Investor Glossary.com


The table comes courtesy of Interactive Brokers


Patrick M. Ambrus
Analyze Capital LLC
Twitter: AnalyzeCapital

Wednesday, September 1, 2010

Bear Trap or Bull Run?-SPX Update


Wait and watch. That is where your tape reading comes in, to enable you to decide as to the proper beginning.

- Larry Livingston, Reminiscences of a Stock Operator

Unless, you were hiding out in a cave somewhere with Osama Bin Laden watching endless re-runs of President Obama's Oval office adress you probably noticed the huge rally in equity markets yesterday. Many analysts, economists, traders, and journalists attributed the rally to 'robust' PMI data from The People's Republic of China, Europe, and The U.S. Though, ADP employment showed glaring mediocrity in job growth leading up to Non-Farm Payrolls on Friday. Regardless of trailing economic data, the tape tells the true story as always.

3 Month Daily E-Mini September SPX Chart


3 Year Daily SPX Chart


Conclusion:
1100 is the key price level I'm looking for. If the candles trade above this line I expect a retest of 1130 and maybe a break out to 1150. This must happen in Tomorrow's session though. I fear awful Non-Farm Payroll numbers will allow the shorts to plunge the equity markets once again. The RSI will move up and re-test 60, if it fails to do this, I expect heavier selling-pressure to result. As of writing time, 12:00 EST, Nikkei is up 32.27 points @ 895.29 down significantly from the open. Make it a good trading day.

Patrick M. Ambrus
Analyze Capital LLC
Twitter: AnalyzeCapita

Illustrious Imperfections


This evening I was perusing FT's Alphaville blog and came across a great piece written by Mohammed El-Erian. The PIMCO Chief Investment Officer breaks down Bernanke's speech from Jackson Hole.

Link:http://ftalphaville.ft.com/blog/2010/08/27/328906/el-erian-how-to-read-bernanke%E2%80%99s-jackson-hole-speech/

Some questions for the FED

El-Erian alludes to some great points....

1. Is the FED over-estimating its 'grip' on the U.S. economy?
2. What happens when Treasury purchases become the new norm?
3. How does the FED's current monetary policy measures stack up against those of other central banks (ECB, BoE, and BoJ)?
4. The main question that trumps all, is the FED comfortable maintaining a $2 Trillion Balance Sheet over the next 10 years?
4a. If yes, will Quantitative Easing become the new tool to re-inflate economies?

Seems to me 'Helicopter Ben' did his homework on the lost decades in Japan.

Patrick M. Ambrus
Analyze Capital LLC
Twitter: AnalyzeCapital
 
Disclaimer
This Blog has been developed by Analyze Capital LLC, and as an independent organization we provide “AS IS” information without warranty. The ideas and opinions expressed by the contributers of this blog are personal and do not represent the actions or policies of Analyze Capital LLC. The contents of this blog do not intend to assert recommendations or to offer advice of any kind. We are not responsible the consequences, be they gains or losses, that may result from using any of the information from this blog.