rss
email
twitter
facebook

Friday, October 30, 2009

Forecast for week - 11.01.09

"By Mid week dollar weakens and SPX will find support off 1030ish"

Technical Equity Updates - 10.30.09

C:

Has gone further sound and hit true support. Maybe bouncing off 2nd deviation BB support. Downtrend will be confirmed if resistance holds between 4.50 and 5.00.

Failure to utilize pattern analysis has really burned me bad on C. I should have noticed two clear even star bearish patterns before each upper 2nd deviation BB pierce.

Though, overall though 3rd quarter fundamentals will prove to shine better in 4th quarter. C will be a better hold on the longer term out. My Entry was just extremely poor based of poor short term trading technical.

This pull back seems a bit unconvincing due to the lack of volume confirmation. Significant resistance we be rested at 5. For the risk adverse, recover your losses around at resistance levels. (limit orders?)

Luckily, overall my capital loss is limited due to its small size.

SGP

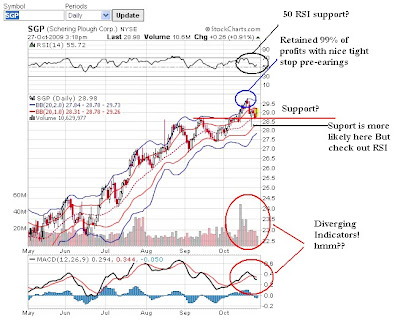
SGP and C are both acting according to 2nd deviation BB piercing rules. Prices bouncing off 28 support will confirm a bull trend. Though the size of the pull back is still unsettling nether the less. Short term tells me wait for a pullback to the upside.


----

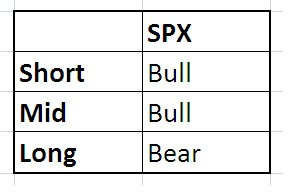
Weekly charts are telling me to wait for prices to bounce to the upside and take my money and run. The weekly pictures are becoming quite ugly. This is confirmed via SPX correlation. Im getting a bit uneasy in the markets right now. Time to reasses the situation.

**On the side now possible upside confirmation is possible as the dollar is set to start weakening again in the short term.

Ill be playing the correlations short term.

---

Tuesday, October 27, 2009

Equity Trades: "The Good, The Bad, and the Ugly." - 10.27.09 Technical Play Update

The Good:


I shorted at the top and exited at the current day (10.27.09)


I shorted at the top and exited at the current day (10.27.09)


**sorry no time to go into details

...

THE BAD


Entry point was around Mid September @ 4.41, Initially went up then down but stayed positive then eventually hit 5.00 October 14th. At this point I knew I had to take profits, but unfortunately I wasn't heavily invested and taking profits would have only produced me a few lunches. I was banking on RSI support at 50 and possible momentum reversal. Though had I been moving lots more capital I would have garnered a much more handsome profit (@ 5.00) worth a few months of rent and then called it quits. Though with some bullish indicators still in tact I decided to maintain.

Unfortunately this was the beginning of my undoing. There are a few things that I neglected:

  • Time Frame and use of indicators of differing time frame (a failure of interpretation on my part).
  • Neglecting macro considerations of the banking sector/earnings season (playing straight technicals actually hurt this time around despite the volatile nature).
  • neglecting lack of volume confirmation (which should have told me to exit at 5).
  • Engaging in risk management fallacy
  • Did not notice failing RSI pattern (weakening RSI)


This trade turned bad past below my break even entry point. At this point RSI 50 support was broken along with any possible in between price support. My risk management fallacy was not adjusting my ATR range and using a 3x ATR stop loss with a 14 day parameter.

Considering my original price target was 5.10 3 ATR clearly would have been above this and thus setting a stop loss so low is pointless. A more meaningful stop loss would have been X ATR below true support (eg 1 or 2 ATR below a 3-5 day parameter ATR).

Though it is valuable to learn from your mistakes: its better to learn from your positives in order to replicate them.

  • entry after 2nd Deviation lower BB touched - waited a few days for indicator confirmation
  • The first half of my trade was conservative while waiting for short term bullish confirmation with decent entry at 4.41.
  • Risk reward ratio was favorable to the upside to 5.10.
  • RSI confirmation

Most of the given bullish evidence was enough for a short term profit. Holding past 5 was a mistake I should have realized due to the developing bearish evidence. Indicators now show that price has room to go further south that will kiss or just bounce off true support. If there is a break of support around the 4.20's, watch the pull back to the upside (recover some losses) and be wary of a resumption of a downward trend.

I will also read adjust my ATR stop loss to a more realistic parameter of 3-5 days to ensure better risk management.

----

"the ugly"

Lots of conflicting indicators though it seems the bearish picture is gaining more weight... My short term bull may be starting to converge into the long term bear... Though I will wait for the pull back to the upside and go mostly into cash due to high downside risk and time constraints.

Monday, October 26, 2009

Early Market Action Thoughts: Oil- 10.26.2009


I spent much of the morning on the Blooomberg looking at charts. CL1 is definitely overbought at the moment and I expect a pull back to $78 as I said in my last post. This morning Nymex Crude was trading around $80.50/barrel. Momentum on the upside is topping out. Additionally, the upper Bollinger band(30, 2.0) has been pierced for too long. However, one must keep in mind that crude will not follow technicals or fundamentals in the long run. Much will depend on the Greenback.

-Pat

Patrick M. Ambrus
Analyze Capital LLC
ambrus.anlzgroup@gmail.com

Thursday, October 22, 2009

Where's Oil Headed? 10.23.09


Crude oil reached a new high of $82/barrel earlier today. I expect the rally today was related to the Chinese growth story as well as continuous dollar weakness. However, a weak dollar is a reality the U.S. government will have to live with for the time being. China reported GDP growth of 8.9% for the 3rd quarter 2009. This may be a farce but numbers can't be fudged more than +/- 200-250 basis points. Hence, the economy continues to grow rapidly, and thus commodity consumption will continue if not grow. Additionally, stocks of Crude oil failed to meet analyst expectations rising only 1.3M barrels last week. My short-term outlook is a price range of $75-85 barrel if the RSI can sustain its momentum. Currently the RSI is overbought at 74.16 with the previous high at 77.81. Also, CL1 pierced the upper Bollinger band at 20 days, 2 standard deviations. I expect a bounce off to about $78 or so before we see more upside movement. Long-term I am extremely bullish. Prices of crude will rocket to $100 by late January early/February. Next week I will look to enter into long position into the USO when prices retreat.

-Pat

Patrick M. Ambrus
Analyze Capital LLC
ambrus.anlzgroup@gmail.com

Thursday, October 15, 2009

What's My Blood Pressure Doc? - 10.15.09 - Banking


After reading through some press releases of some of the largest investment/commercial banks in the world I am a bit surprised. Sure I expected to see record trading profits from Goldman and Similar amounts from JP Morgan and Citicorp. Yet, Commercial lending still has not recovered, consumer loan-loss provisions have not decreased as much as expected, and credit is still tight everywhere. Is Goldman really doing the right thing allocating $16B for the compensation of employees? I am not saying bankers are overpaid or questioning compensation practices because I do believe in capitalism. The market sets the price for compensation so that is not my point here. My point is, If we see another downturn can Goldman sustain record trading in Fixed income, commodities, currencies, and equities? Not to mention, Goldman is now 2nd in Global M&A and further behind in underwriting of debt and IPO's. However, the firm has reduced leverage from 35 at the peak to 16x capital available for trading. The same profitable trading story can be told about JPM. Though, the company lost $(700)M in their credit card division for the 3rd Q. I thought commercial banks made profits from this business? I guess not. I need to do much more research and find out what the Tangible/Tier Capital equity ratios have to say about company health. Just as we receive physicals every 6 months banks should do the same. The process is humiliating sometimes, but it is also nice to know how healthy you really are.

Words of Wisdom: Don't buy into the hype, do your own homework

--Pat

Patrick M. Ambrus
Analyze Capital LLC
ambrus.anlzgroup@gmail.com

Equity Plays - 10.15.09 - SGP and C

C:


I would Expect C to be a long core position. After reading about my colleagues fundamental analysis of C. The long term technical picture is confirmed. C has great potential for long term growth from a valuations and technical standpoint. Today's move just reflect, as I wrote yesterday, a correction from over-exuberance. This may give an opportunity to re-up if 50 RSI support holds.

Be prepared to add in if you see those higher lows. I know I will.


==========================

SGP:


I updated my risk management on SGP considering my sizable position. I set to take profits roughly around 1 ATR below current prices. Due to the high probability of noise my order will most likely get filled. Which is fine, since I will re-up (re-pyramid) on the pullback as SGP is due for a slight correction.

I expect SGP to trade overbought into the next week due to the volume confirmation. It seems that SGP has a bit more room to the upside after its due correction before hitting significant technical resistance. (31? 32? ... anyone?)

Again watch for those higher lows!


======================

-Alex

Wednesday, October 14, 2009

Thought of the Day - 10.14.09

"Mind the exuberance"

Can the Euphoria Last? - 10.14.09 - Market Commentary


Good Afternoon all. Markets are flirting with psychologically important levels. The Dow is up over 100 points inter-day, closing in on 10,000. The SPX is already over 1085, proving a technical resistance break. The dollar remains weak against the Euro. Yet much of this rally can be attributed to JPM results. I undeniably see a financials led rally if we see strong earnings from the likes of C, BAC, and GS. Additionally INTC and JNJ posted solid earnings yesterday after the bell. However, this rally is in-line with my thesis. It is only a matter of time before we see a large correction.

Monday, October 12, 2009

Are we there yet? - 10.13.09 - Sentiment Analysis


Markets are mixed today ahead of earnings from INTC, IBM, GS, JNJ, JPM, C, GOOG, and GE. Nevertheless, this is an immense week for U.S. equity indexes. Depending on earnings results we could wind up seeing a steep drop off in equity prices as well as a continued dollar slide. In addition, the more the $USD erodes the more it will affect equities. There will come a point where the gains made by European investors will not offset the dollar erosion. I am not saying stocks will sell-off and break technical support in the short-term. I am only suggesting the longer-term effects 3rd quarter earnings can have on financial markets. I actually believe quite the contrary near-term. The buoyant bottom line numbers from the aforementioned Blue Chips should be enough to inject euphoria into traders. The sell-off will come when traders realize the economy is not recovering as fast as it should. Hence, the market will realize that valuations are ridiculous and we will finally see that 10% correction.


For a more logical view of my thesis I suggest examining the above chart of the VIX or Volatility index. “The VIX is a key measure of market expectations of near-term volatility conveyed by S&P 500 stock index option prices. Since its introduction in 1993, VIX has been considered by many to be the world's premier barometer of investor sentiment and market volatility” (CBOE, VIX). Over the past month the VIX is trading in a range between 22 and 29.5. However, when examining the RSI and MACD there appears to be more room on the upside. Specifically, the RSI is only at 40. It needs to reach about 65 if more significant downside action will come. Also, I see a trend of higher highs forming. If this comes to fruition, we could see 30-33 in a month. Historically, when the VIX trades above 30 we see severe volatility. Translation: The higher the VIX goes the more selling we will see. The selling will start by the first or second week of November; at this time markets will correct.


Price Targets on SPX

Short-term (3-4 weeks): 1075-1080

Long-term (3-4 months): 985-990

By: Patrick Ambrus

Friday, October 9, 2009

Daily SPX market Commentary - end of the week - Inter-temporal Technical Analysis 10.09.09

**This is the WEEKLY chart - Long Term bullish or bearish?


On the surface the longer picture looks more bearish with a perfect bearish SMA formation (reverse bull perf formation). However one must consider the nature of long term charts and at the velocity they move. This is similar to the idea of secular bear markets. Longer terms charts maybe in downward trend, but can experience prolonged bear market rallies that last months or years. Being aware of time frame is key in inter temporal technical analysis.


So with this in mind, if RSI support at 50 holds, the SPX can have significant room to move up if it is indeed in a short term bull market rally (within a longer term bearish thesis).

*side note: in the past few days I have been discussing with my colleague, Pat, on the nature of "economic man" as an ideal type in the fundamental frame work for neo classical economics. The point is that a typical neo-classical framework will prove useless as a tool for analysis, at times, for a trader, during times of extended periods of irrationality (i.e. last summer with oil prices at 147, perhaps this bull market rally?)Economic analysis is limited in its explanatory power when it comes to financial markets interaction with social behavior. This point also extends to Quantitative financial modeling which is limited to its explanatory power since it also lacks the correct social fundamental framework.

Now the point of the side note is to explain the possibility of why price a range of 1200 to 1300 is possible. Partial Dow theory (ie the technical analysis I am using) + human irrationality (sentiment aspects) shows price movements that can reach such highs confirmed by RSI support at 50 with MACD trading around center line balance on default parameters. (one can back test this idea of "irrational" moves during bear markets/secular bear markets - open up a history book and some charts if you want to do this...).


So to summarize this Jargon up in simple concise terms:

My analysis shows a long term bearish picture out 3 quarters or so. The main supporting evidence for a longer term bearish picture is that the PERF SMA bearish formation is still in tack. However in the mid-term about two quarters out, the SPX can see strong bullish trends (this is supported by short price movements above the 50 SMA acting as short term support).

The biggest risk to a mid term bull thesis is that if fundamentals trump expectations and sentiment which would send the MACD well below center balance for a considerable amount of time. At this moment the MACD looks as if it will top out in 1 more quarter or so. To see if the MACD will remain around center line balance I will be watching RSI support closely. RSI support holding (bounces of 50 support) will need to be confirmed with higher highs and higher lows and daily chart perf SMA formations.


The inter-temporal contrast: The Short Term SPX:

The Short term confirms the mid term bullish thesis. <--- click here for short term analysis>

However, will give a brief summary of today's price action:

**This is the DAILY chart


Long Term Outlook - Bull or Bear?

As we see today, my call on 1070 was correct as yesterday highs hit 1070 and pulled back. However, today the 1070 resistance has been broken at the SPX closed at 1071.49. Next week will be huge with earnings from major names in the financial sector. If resistance has indeed broken, I will be looking for higher movements next week which would probably coincide with positive earnings reports. I am certainly getting MACD momentum reversal confirmation which makes good earnings seem more probably.

The next bullish pattern I will be looking for is a new lower low. So watch out for that pullback after earnings.

Also the main reason I am short term and mid term bull is because of the daily chart SMA perfect formation.


Outlook Summary:

Food for Thought: SPX and USD - Market Direction 10.09.09


This morning I spent a substantial amount of time looking at stock charts from various sectors in order to decipher the mystery that is the S&P 500. I looked at the SPY, XBI, XLF, GS, AAPL, GOOG, AMZN, QQQQ, IWM, MDY, and VIX. Undoubtedly, the market is overbought. It is overbought from a fundamental valuation standpoint . Technical Analysis of these charts support this thesis. Especially, when examining the SPX and $USD. Though one can argue the SPX is in a bullish trend, the index is yet to show markets it can break resistance around 1075. As for the USD, the chart shows a bottom forming very soon with momentum trending upward. I maintain my position in cash for the time being until I unlock Standard & Poor's Box .


--Pat

Wednesday, October 7, 2009

SPX Daily Market Commentary - 10.07.09 -Technical Preview


The Bullish Picture:

  • Bullish Pattern formation of higher highs and higher lows since the July Rally


  • Bullish RSI behavior confirmation of staying above > 50 since July


  • MACD longer cross over shorter EMA (exponential moving average) --> bullish momentum reversal


  • Bullish Positive divergence with down-trending MACD vs up-trending price movements.

  • Support at 1020


  • Bearish Evidence - Weakening full out bull trend:


  • MACD center line balance > 1 since July --> sustained trend less likely


  • Resistance at 1070


  • Late Sept RSI pierced below 50 (maybe whipsaw), and resistance at 1075 would coincide with RSI @ 70 topping out.


  • Bullish thesis is lacking volume confirmation


Summary:

There is enough bullish evidence to confidently say prices will return to 1070, if true support was found at 1020. A few posts ago I said I would comfortable if markets fell to 1010 which would give a stronger momentum push back up to resistance. At this moment my call for 1010 support seems to be wrong and the 2nd deviation BB may have acted for short term support at 1020. The bearish evidence may point to side ways trading as confirmed by light volume.

So how can we tell if 1070 will be broken? Watch for a series of higher highs and higher lows. One can also look to correlative inter-market evidence. E.G. A high correlation between Major pairs such as the EUR would mean weak dollar ==> strong equities. As my last post showed, I had a general weak dollar thesis. If this is the case, one could expect sideways trading lead to a break in resistance of 1070 eventually.

I would certainly back up a thesis with broad base market fundamentals. As in this volatile market, fundamentals can certainly trump technicals...

I will maintain short term bull on the S&P500 until 1070 and reassess

-Alex

Tuesday, October 6, 2009

Wise Words from Pat Ambrus - Market Commentary - 10.06.09

Thoughts on Today’s Market Action


“Volatility is quality or state of being volatile; disposition to evaporate; changeableness; fickleness,” (Brainyquote.com). If you were long any type of financial product (except shorts) you are probably a happy trader today. Equity Indexes continued to run as the Dow Jones Industrial Average was up 1.47% led by XOM, CVX, IBM, JPM, and UTX, all of which gained more than 1% today. The S&P popped 1.4% led by producers of energy and raw-materials, up 2.1% and 1.9%. Specifically, Newmont Mining led the charge upping the ante by 7%. You already know all of this if you followed the markets today. However, if we examine the broader picture maybe we can find out what the hell is going on.

Treasury Auctions were oversubscribed to today (3 year bonds @ 1.445%). Anyone Bullish? The big story of the day was gold which sky-rocketed to $1,043.10 up 2.49%, reaching an all-time high. What can this tell us? This movement was probably a strict reaction to Australia’s decision to raise interest rates by 25 basis points to 3.25%. "It is now prudent to begin gradually lessening the stimulus provided by monetary policy," according to the Australian Reserve Bank. The movement upward can be viewed purely as an inflationary hedge. However, rumors came out today of Russia, China, Japan, France and Gulf States secretly talking about replacing the dollar as the chief currency for oil. If this happened the Greenback could seriously slide.

Oil was up 1.4% on the day $71.21/barrel. Crude is still trading in a technical range of $66-$73.50. I am staying away until I can figure out what my long-term goals are for the commodity. Nat Gas declined to $4.90 down $0.09 on the session. Not really sure where this is going on here but I will not play the UNG until it drops to more reasonable levels. I will look to get in around $10.50 with stops around $10.35

Gold check, Treasuries check, Oil check, weak Dollar check, Equities rally??? I am not happy about the direction of the S&P. I still believe markets will correct 5-10% and if it breaks support then we could be in for a free fall. Currently, if you want to trade .SPX, play the charts. I will look to get back in the SSO around $30-31.

Authored By: Patrick Ambrus

FX Daily Update - 10.6.09


Overall I have a general weak dollar thesis in mind. Some SMA action in the GBP questions mid term strength of the GBP direction. Soon I will re-balance my portfolio to incorporate some currency ETF's since I can't move my capital around too much until the beginning of next year.

I will consider trading ULE, YCL (yes I will start tracking the Yen once again!), BNZ (if i can't find a Aussie pair I like). I will have to look around for some GBP and AUD ETFs. For hedges I will consider UUP and UDN. Also, I will try to do some research on RYDEX products. If anyone has an opinion on these products let me know!

-Alex

Daily Morning Forex Commentary - 10.06.09


A rather significant move on the hourly chart. It seems that the EURO equities are feeding of the US equities from yesterday. With such dollar weakness today I'm expecting another strong day in the US domestic equities (will energy and financial sectors lead or will the consumer sectors?).

EUR:

Hourly Chart:

The EUR has already pierced its upper 2nd BB as we speak and is poised to retrace back to its lower 2nd SD BB. Its seems as the EUR is range bound at 30-40 pips, as I drew out via support and resistance levels. This is more confirmation that a big move is on the way, especially with the light volume we have been seeing across all markets.

The 6-month Daily chart is equally impressive, it is reminiscent of the EUR moving a few days earlier than the previous BOE Quantitative Easing Announcement back during summer.

Other Major Pairs:


3/4 the four major pairs I'm following confirm the price squeeze seen in the EUR leading to dollar weakness. The major pairs confirming this being: GBP, CAD, and EUR.

The only pair that contradicts this is the AUD

AUD and Asia Pacific Events:


"BIG NEWS" <-- Click Here>


MR. Stevens of the RBA (Reserve Bank of Australia) today decided surprise everyone with a interest rate smack in the face of a 25 basis point increase. He must be bragging about how well his economy is doing. But, on a more serious note, this maybe reflecting some fundamentals in the Asia region: Strong consumer demand in the East, commodities strength (confirmed via dollar trend weakness), and possibly hinting at inflation worries.

What I'm interested in is if this move is significant enough to affect the JPY and maybe reignite carry trade fundamental plays in the currency arena.

I'm also aware that southeast Asian equities have been performing quite well compared to two summers ago when equity markets were dieing along with hyper inflation in some countries (eg, Sri Lanka and Vietnam).

All these circumstances makes me think HSBC management knows something everyone else doesn't, as they are selling off assets in more developed countries and focusing on more growth oriented countries.

"HSBC NEWS <-- Click Here">

But then again, HSBC has always been oriented this way, its banking model is conducive on focusing on top priority countries with highest growth rates and rotating best performing managers to new developing regions. In a sense this is kind of a managerial meritocracy. This model has certainly thrived in the HF industry and maybe points to why HSBC has survived "relatively" better than its peers.

As I pointed in my last blog Stephen Green, predicted that the recovery will be Asian led last summer. Based on HSBC's strategic moves, its possible they don't believe the recovery has begun in full force yet.

I will end with a quote from an EX Deputy CEO of Corporate Banking HSBC who I used to work for in Vietnam.

"China certainly will certainly can keep us busy for the next decade or more."

Such a thought is definitely worth thinking about when one orients their strategy in a constantly evolving financial landscape. The point should also extend to all emerging markets, just not Asia alone...

Anyway... Off to class!

-Alex
Monday, October 5, 2009

Comments on "Trader Mike's Market Recap": SPX market commentary - 10.5.09


Trader Mike's Market Recap for 10.5.09 <-- click here>

I will have to say that my analysis is in agreement with trader Mike's in terms of the SPX. He brings out a very good point about low volume levels. He calls this a "purely technical" play (ie. prices bouncing off 50 SMA). For those looking for more of a fundamental perspective, today can be considered people covering their short sales from Sept. 29, 2009, hence the relative volume weakness.

I will also like to add in that if prices do continue to form higher lows and lower lows, I expect support at around 1010 (4 week ATR calculated range). 1010 maybe a bit too extreme if one were looking at Bollinger Bands, either way 1000+ support is a key level to be watching. This key level will determine whether or not the SPX topped out at 1070 or if it will confirm a bullish trend that is still in place.

Either way prices are coming to a squeeze as seen in default parameter bollinger bands. Keep in mind, any directional move will certainly needed to be confirmed by volume to ascertain true trend.

Google Search: Analyze Capital LLC & "Analyze Capital LLC"


  • Looks like we make it to front page, 1 away from the top spot.


  • The specific search yields two results and Son's Profile! Good work Son, whatever you did to get on that search!

Thoughts on the U.S. Economy - 10.05.09 - An Email Dialouge


Alex,


(CLICK HERE FOR LINK I SENT TO PAT <----)


Its funny you sent me this because I was just about to e-mail you an article of quotes from Roubini, Soros, and Geohegan. I do agree with this sentiment as you know I am bearish. The fact is that Valuations are too high right now. Also, as we see 3rd quarter earnings we will see bad top line numbers which will matter much more in economic growth, job creation, and undeniably equity prices. A W shaped recession would not surprise me at all. Seeing as we have pumped so much stimulus into a system that is now feasting on it. I think Sauros is right to "trade the fed" or central banks for that matter. Is deflation really a concern? May be. Could we see this equity market collapse again? 50/50. It depends on how much guts investors have. Will investors pull money out if the market starts to go down? probably. Think Cattle mentality. As you and I have even discussed, If the S&P breaks support levels around 1005 or so it could free fall. If this is the case it means two things for Analyze Capital LLC: 1. We need to figure out a way to play this as a "hedge." 2. "We will need to follow the economy and earnings very closely to determine equity prices in the near term. It is entirely possible that "trading the fed"/earnings going forward is the correct way to play equities. Only time will truly tell what happens.

I'll leave you with this. "When you do battle, even if you are winning, if you continue for a long time it will dull your forces and blunt your edge; if you besiege a citadel, your strength will be exhausted. If you keep your armies out in the field for a long time, your supplies will be insufficient...Those who like to fight and so exhaust their military inevitably perish" (Sun Tzu, The Art Of War).

Saturday, October 3, 2009

Reflection on Market Movements ending 10/2/09

  • Weak US jobs data along with relative dollar strength.


  • Dollar strength with oil up around 70.


  • Strong Dollar Weak Equities.


  • Strong Dollar Strong Gold at 1000+ levels.


The only play that may have made sense was risk aversion to gold due to economic weakness. It seem that the Euro and Asian Equities are just following the US drop. With Correlations out of whack, Im just glad I'm a technical hybrid.

It will be interesting to see if gold will break out of its range bound trading. Technical resistance at 1000 has been holding for so long now. Price Pressure certainly must be building.

The best way to play this market, when nothing seems to be fundamentally sound, is using Technical and Sentiment analysis. Carefully observing the sentiment indicators and technicals should give a trader/manager leading indicators as to how markets might react to trumping fundamentals. If this doesn't seem feasible, one should be in cash or close to being fully hedged.

-Alex

PS: much of this volatility maybe due to pricing in of a bad upcoming earnings season. If one believed the past earnings season was due to cost cutting and severely reduced expectations, this upcoming season must be a bearish one considering underlying economic fundamentals have not significantly changed. One key sector that may lead this move is the financial/banking sector. One can confirm overall SPX movements by individual equity analysis vs expectations in the sector if they believe the financial sector to be of significant importance. If a bearish thesis plays out I expect the SPX to hit 1010 within a four week time frame.

Friday, October 2, 2009

SGP Technical Play - 10.02.09


Technical Indicators:

Bullish Evidence

RSI:

Showing Upward Price movement to 70+ range. Has Proven in the past that it has traded above 70 for few days to two weeks.

MACD:

Momentum is going to switch from downward momentum to upward momentum (longer average crossing under shorter average). Seen on the longer term chart (1 year or so) Momentum is far from highs seen in April 09 (well above 1). In other words, momentum has lots of room to the upside.

SMA:

Continued Perfect formation; though some short term risk if prices interact with 50 day SMA.

Volume:

No significant volume that matches marches highs. Though relatively higher than the past two months indication some support for short term movements up. Also confirms a bullish trend up.


Candle Stick Analysis:

Bullish Engulfing forming today.


Bearish Picture:

Resistance:

Experience technical resistance around 30.

Fundamental Risk:

Prolonged permission from FTA to permit Merck Merger.


Summary:


Technical resistance is probably reflecting fundamental risk which may force price to behave in a sideways manor.

Overall the bullish picture seems to be intact with multiple confirmations across trend, pattern, and candle stick analysis.

Its the end of the week. I would suggest adding in if you are long since prices have relatively pulled back from September highs. If you are a bit risk averse due to overall market thesis you could possibly hedge with a put option around entry price. My option duration would be until the end of the year due to tax purposes (though I'm not to sure how expensive this hedge would be, so for example, don't hedge this way if the cost of hedge exceeds your risk/reward ratio expectations).
 
Disclaimer
This Blog has been developed by Analyze Capital LLC, and as an independent organization we provide “AS IS” information without warranty. The ideas and opinions expressed by the contributers of this blog are personal and do not represent the actions or policies of Analyze Capital LLC. The contents of this blog do not intend to assert recommendations or to offer advice of any kind. We are not responsible the consequences, be they gains or losses, that may result from using any of the information from this blog.