rss
email
twitter
facebook

Thursday, April 29, 2010

Japanese Unemployment- 04.29.10


The number of unemployed persons in March 2010 was 3.50 million, an increase of 150 thousand or 4.5% from the previous year. The unemployment rate, seasonally adjusted, was 5.0%.


Patrick M. Ambrus
Managing Partner
Analyze Capital LLC
ambrus.anlzgroup@gmail.com

German Unemployment for March- 04.29.2010


The unemployment rate was forecasted to be 8.00%. Instead we saw a 7.8% rate this morning. This correlates with a 20 basis point drop in Unemployment from February to March. Sustainable?

According to provisional results of the Federal Statistical Office (Destatis), the number of persons in employment living in Germany amounted to 39.9 million in March 2010. Compared with March 2009, that was a decrease of 138,000 persons or 0.3%. In January and February 2010, the number of persons in employment was 0.4% each below the previous year's level. Consequently, a somewhat slower year-on-year decrease in employment was observed in the reference month of March 2010.

As a result of spring recovery, the number of persons in employment rose by 114,000 or 0.3% in March 2010 on the preceding month. After seasonal adjustment, that is after the elimination of typical seasonal variations, there was a small increase of 12,000 persons (+0.0%) compared with February 2010.

Beyond the first calculation of the number of persons in employment for reference month March 2010, the monthly results on employment published previously were recalculated for the second half of 2009 and for January and February 2010. All sources of employment statistics that became available in the meantime were evaluated for the purpose. The recalculation of the monthly results produced year-on-year rates of change that were only slightly higher or lower than the previous results (deviation of a maximum of 0.1 percentage points at the level of the overall economy).


Patrick M. Ambrus
Managing Partner
Analyze Capital LLC
Twitter: AnalyzeCapital

Wednesday, April 28, 2010

Brief Market Notes: April 28, 2009


Thoughts:

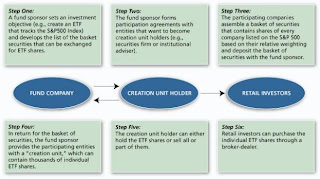
ETF markets - Post crisis investors are looking to increase their risk appetite. It would seem that brokers/financial institutions are repeating the same mistakes pre-crisis; and the same practices seen throughout retail banking, of pushing products not fully understood, onto unknowing consumers.

ETF's are quite complex structured products akin to derivatives imho. My partner, Pat, can tell you much better than I, as he has way more experience in trading commodity related ETF's. Often correlations will remain high with the underlying instrument it is built off, but has many more dynamics of its own.

ETF's built off other indices or built off futures or bonds are at risk to those respective market risks, and the risk of the product itself. Indexation and limits to indices are complex issues in itself, enough to make my head spin.

In addition to those risks are the risks of the ETF market itself pertaining the economic aspects. Supply/Demand balances are often limited to how the product maybe structured. Due to limits of the product excess demand can out-weight supply causing price correlations to break down in the short term (or flip flopping between backwardization and contango if based of futures). The short term being a few days to a few weeks of price divergence as we saw in the natural gas ETF market back in summer of 09.

If traditionally passive investors are informed by their brokers that ETF's make an alternative low risk way to diversify their portfolio, this is a grave mistake. This in effect will make the ETF market more naive in the long run if more passive type markets start to invest into the market, thus increasing the risk of adding more volatility to their portfolio. Often short run fluctuations can cause investor/trader behavior to panic and cause herd mentality sell offs (or bullish runs in light of positive sentiment).

I am not trying to say if x happens then y and z shall follow but, there are real risks that makes the ETF market much more complicated on a deeper level than simple indexed products that mirror larger products at a lower cost (the cost issues are a whole different topic on its own that I shall not get into).

Hopefully going forward investors will keep up with due diligence and not blindly invest in products unknowingly as back in 2008.


----

Alexander Lê
Managing Partner
Analyze Capital LLC
email: analyzecapital@gmail.com

Those Grey Swans of Extrimistan- 04.28.10


“The issue is rollover risk,” said Jonathan Tepper of Variant Perception, a research group based in London and known for its bearish views on Spain. “Spain has to issue new debt to the tune of 225 billion euros this year. Forty-five percent of their debt is held by foreigners. So they are dependent on the kindness of strangers.”

I found this excerpt interesting as I was browsing the NYTimes this morning. Is this a crisis of debt or of confidence? I prefer the latter. Without confidence in the market place refinancing or issuing new debt will come at the cost of a hefty liquidity premium. Additionally, the media continues to hype up this mess, fueled by the ratings agencies (fools) whom are also growing extremely pessimistic.

Will this crisis of confidence cause us to play another lethal game of musical chairs? I hope not. No one is safe in those type of games. I am not sure The Global Financial Markets can go another round without some type of catastrophe. And by catastrophe I mean something along the lines of the Russian Ruble crisis in August of 1998. Not, Systemic Risk or the Moral Hazard of bailing out large institutions. The day a sovereign nation becomes an institution that needs loans beyond reasonable measure of the IMF or an unnamed central bank is the day I dread.

Throughout the Crisis of 2008 till present times, financial gurus, experts, and publications alike claim stability and recovery based on changing and unconfirmed information. Unfortunately, there is no way to confirm a positive outcome in these type of games. Tomorrow is promised to no one. For instance, what if Spain is pummeled by a meteor tomorrow? Debt ratings will be the least of their concerns. There is no way to calculate irrational randomness.

My solution: look for information that disconfirms/challenges the common or popular information that looks for stability and normalcy, which is presented by financial experts, analysts and journalists alike. When I find this information, I most likely will not know it. Also, the disconfirming information probably hides where I would least expect to find it. Thus, I will need to maintain a disconfirming/challenging mindset and logic out the details/nuances of new/sexy/popular information. For example, the disconfirming information may be what FOMC Chairman Bernanke does not say. A Nascent recovery is far from a Definite recovery.

Henceforth, I will trade with agressive caution. I will look to minimize my greatest risks while also maximizing my smallest risks. Well wouldn't this be the same as swapping risk and/or increasing my unknown risks? No. By identifying the greatest risks with disconfirming information, the least risky opportunities should become readily identifiable. For instance, If I want to vacation in either Los Angeles or New York this weekend I would probably think about witch one would provide greater returns of fun. However, if I knew that there was a 30% chance of an Earthquake in LA, but in NY 90% chance of cold rainy weather, I would go to New York and maximize my fun returns or stay home and host a cocktail party with friends. Therefore, the least risky opportunity presented itself once I ascertained my greatest risk (vacationing in L.A.).

I hope I did not confuse anyone with my logic here. Recently the writings of Nassim Nicholas Taleb have influenced me to start thinking or become confused, depending on your own interpretation of my thoughts.

As I start finding disconfirming information I will present it. Maybe then my ideas/reasoning will become transparent. Until then, enjoy the uncertainty and opportunities to make a killing.


Patrick M. Ambrus
Managing Partner
Analyze Capital LLC
Google Buzz: Analyze Capital

Tuesday, April 27, 2010

Early Bird Missed the worm but got it later: Shorting the SPX - April 27, 2010


April 27, 2010:

A 2.34% move is certainly nothing to scoff on the SPX. As shown by the red line my entry was a few days too early as my position moved against me 1.33%. I kept my stops wide enough and today paid off. I expect prices to at least reach 1160 where I will take some profits and reassess as 50 SMA resistance can be strong, however as the blue circles indicate there is plenty of technical bearish indication the trend may go lower (Volume confirmation and momentum reversals). As is, I will be riding the short term trend for as long as it stays healthy. Though overall, quarterly time frame I am leaning to be more bullish, but more on that later... back to finals studying!

German Import Prices- 04.27.10


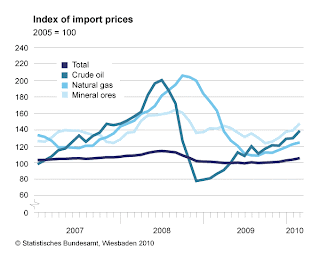
As reported by the Federal Statistical Office (Destatis), the index of import prices increased by 5.0% in March 2010 from the corresponding month of the preceding year.From February 2010 to March 2010 the index rose by 1.7%.

The index of import prices, excluding crude oil and mineral oil products, was 0.7% above the level of a year earlier (+1.1% compared to February 2010).

The index of export prices increased by 2.0% in March 2010 from the corresponding month of the preceding year. From February 2010 to March 2010 the index rose by 0.8%


Why am I posting at this time of night? Good question. However, I am concerned about the run-up in global equity prices. I expect to see a pullback of 3-5% within the next week or 2. Hence, any data that might give an indication of trading sentiment (SPX, DAX) will be useful. Currently I am analyzing the SPY and SSO (2 ETFs which track the SPX).


Patrick M. Ambrus
Managing Partner
Analyze Capital LLC
Facebook: Analyze Capital

Thursday, April 22, 2010

PPI- April 22, 2010


Via Bloomberg:

Producer price inflation unexpectedly surged as atypical winter freezes jacked up food prices and gasoline made a partial comeback. The overall PPI rebounded 0.7 percent after declining 0.6 percent in February. The boost in March was considerably above analysts' expectation for a 0.4 percent increase. At the core level, the PPI inflation rate was steady with a 0.1 percent gain that also matched market forecasts.

The jump in the headline PPI was led by a 2.4 percent spike in food prices, after a 0.4 percent rise in February. The March surge reflected the loss of some vegetables to atypically cold winter weather in key growing regions in the U.S. For the latest month the fresh and dried vegetables category surged a monthly 49.3 percent.

Turning to energy, this component rebounded 0.7 percent after dropping 2.9 percent the month before.
Gasoline rose 2.1 percent after a 7.4 percent drop in February.

At the core level, inflation is almost nonexistent outside of commodities related gains. According to the BLS, 85 percent of the core rise came from higher jewelry prices due to higher gold and other metals costs.

For the overall PPI, the year-on-year rate jumped to 6.1 percent from 4.6 percent in February (seasonally adjusted). The core rate year-ago pace edged down to 0.8 percent from 0.9 percent the month before. On a not seasonally adjusted basis for March, the year-ago increase for the headline PPI was up 6.0 percent while the core was up 0.9 percent.

Inflation at the producer level jumped in the latest month but much of it is temporary as food price inflation will ease as crops from other regions come into play, adding to supply. And while high, oil prices have steadied.


More evidence to the Fed to keep rates in check through years end? Maybe not. However, If I had more time I would pick apart the energy portion of this report. I would like to know if their are any potential inflationary trends. Also, Check out Alex's update on Financial Equities.


Patrick M. Ambrus
Managing Partner
Analyze Capital LLC
Facebook: Analyze Capital(click the link up top)

Morning Technical Review: Financials - April 22, 2010


Financial chart's I was reviewing:

BAC
GS
MS
JPM
WFC

All are looking looking like that they are in correction mode, however if those feel that the financials are cheap and have long term growth potential (i.e. a possible return to consumer loaning, capital market action, increased trade supply... moving away from trading oriented bottom line growth or whatever factors you are fundamentally factoring)... the short term technical picture says there is a buying opportunity right above 50 SMA. For conservatives wait for the price action to bounce off support.

The only stock above that is not inline with this thesis is GS. Too much selling volume and uncertainty from its recent media spotlight has blurred entry points from a technical stand point.

But hey don't take my word for it...


------

Alexander Lê
Managing Partner
Analyze Capital LLC
email: analyzecapital@gmail.com

Wednesday, April 21, 2010

Crude Oil Inventories/Commodities Update- 04.21.10


Crude oil inventories rebounded 1.9 million barrels for the April 16 week with refined stocks also up. Motor fuel jumped 3.6 million barrels; jet fuel edged up 0.4 million; distillate fuel oil; gained 2.1 million; and residual fuel oil rose 1.8 million barrels. Crude is up a little more than expected and spot crude dipped on the news, edging down about two bits to $83.19. Final demand is mixed as gasoline demand is up 2.7 percent from a year ago while jet fuel is down 0.3 percent and distillate demand is minus 0.1 percent. Refineries operated at 85.9 percent of capacity for the latest week.

•Crude is currently off by -$0.15 sitting @ $83.70/barrel

•Natural Gas is little changed on the session down 50 basis point @ $3.96/british thermal unit

•Gold is up $7.50 today, finishing at $1146.70/troy ounce.

Today and tomorrow I have a copious amount of school work. The mountain gets steeper the closer I get to graduation. However, I will try to update the blog with the usual economic/market data. Be sure to check out Alex's Forex post below.


Patrick M. Ambrus
Managing Partner
Analyze Capital LLC
Follow us on Twitter: @ AnalyzeCapital

Brief FX technical notes: April 21, 2010

Still plenty of technical indication that dollar is still in an uptrend across most major pairs. The short term is however rampant with economic differences that are driving the volatile prices swings we have been seeing (e.g. Hung parliament/volcano for GBP, Greek situation/Volcano for EUR, Speculative behavior and return to risk aversion to US markets, to Chinese speculation of yuan flotation for Asia Pacific affecting AUD).

Will take a closer look after finals...


----

Alexander Lê
Managing Partner
Analyze Capital LLC
email: analyzecapital@gmail.com

Tuesday, April 20, 2010

BOC Interest Rate Decision- April 20, 2010


The Bank of Canada today announced that it is maintaining its target for the overnight rate at 1/4 per cent. The Bank Rate is unchanged at 1/2 per cent and the deposit rate is 1/4 per cent.

Global economic growth has been somewhat stronger than projected, with momentum in emerging-market economies increasing noticeably. Exceptional stimulus from monetary and fiscal policies continues to provide important support in many countries. The recovery in the major advanced economies is still expected to be relatively subdued, reflecting ongoing balance sheet adjustments and the gradual withdrawal of fiscal stimulus commencing later this year. Despite recent progress, considerable uncertainty remains about the durability of the global recovery.

In Canada, the economic recovery is proceeding somewhat more rapidly than the Bank had projected in its January Monetary Policy Report (MPR). The profile for growth is more front-loaded than that presented in the January MPR. The Bank now projects that the economy will grow by 3.7 per cent in 2010 before slowing to 3.1 per cent in 2011 and 1.9 per cent in 2012.

This profile reflects stronger near-term global growth, very strong housing activity in Canada, and the Bank’s assessment that policy stimulus resulted in more expenditures being brought forward in late 2009 and early 2010 than expected. At the same time, the persistent strength of the Canadian dollar, Canada’s poor relative productivity performance, and the low absolute level of U.S. demand will continue to act as significant drags on economic activity in Canada. The Bank expects the economy to return to full capacity in the second quarter of 2011.

The outlook for inflation reflects the combined influences of stronger domestic demand, slowing wage growth, and overall excess supply. Core inflation, which has been somewhat firmer than projected in January, is expected to ease slightly in the second quarter of 2010 as the effect of temporary factors dissipates, and to remain near 2 per cent throughout the rest of the projection period. Total CPI inflation is expected to be slightly higher than 2 per cent over the coming year, before returning to the target in the second half of 2011.

In response to the sharp, synchronous global recession, the Bank lowered its target rate rapidly over the course of 2008 and early 2009 to its lowest possible level. With its conditional commitment introduced in April 2009, the Bank also provided exceptional guidance on the likely path of its target rate. This unconventional policy provided considerable additional stimulus during a period of very weak economic conditions and major downside risks to the global and Canadian economies. With recent improvements in the economic outlook, the need for such extraordinary policy is now passing, and it is appropriate to begin to lessen the degree of monetary stimulus. The extent and timing will depend on the outlook for economic activity and inflation, and will be consistent with achieving the 2 per cent inflation target.


My guess is The BOC waits for the Fed or ECB before it begins to increase the overnight rate. Though, I am curious about the projected GDP growth of 3.7% in 2010. WIl the Loonie continue to strengthen against major pairs (USD, EUR) going forward?


Patrick M. Ambrus
Managing Partner
Analyze Capital LLC
ambrus.anlzgroup@gmail.com

German ZEW Indicator of Economic Sentiment-04.20.10


ZEW Indicator of Economic Sentiment - Outlook Improves Considerably

The ZEW Indicator of Economic Sentiment for Germany increases by 8.5 points in April 2010. The indicator now stands at 53.0 points after 44.5 points in the previous month. This value is well above the indicator's historical average of 27.3 points.
Thus, the financial market experts expect the German business activity to continue to recover from the economic crisis within the next six months. The financial market experts' positive expectations seem to have been decisively reinforced by the recent increase in exports and stable incoming orders.

"Currently impulses from exports invigorate German business activity. Indeed these impulses are necessary to stabilise the upward trend of the economy," says ZEW President Prof. Dr. Dr. h.c. mult. Wolfgang Franz.
The assessment of the current economic situation in Germany also improves in April. The corresponding indicator rises by 12.7 points to minus 39.2 points.

The economic expectations for the euro zone increase considerably in April by 8.1 points. The respective indicator now stands at 46.0 points. The indicator for the current economic situation in the euro zone improves by 8.9 points and now stands at minus 52.4 points.


The above text was translated via google from German to English.


Patrick M. Ambrus
Managing Partner
Analyze Capital LLC
ambrus.anlzgroup@gmail.com

Monday, April 19, 2010

New York City Housing - April 19, 2010

CLICK HERE <----60 million dollar apartment


Anyone else think this apartment is a wee bit overpriced? I think back in late 05 infamous hedge fund manager DANIEL S.LOEB <--- paid 45 million dollars for his pent house at 15 central park west. (funny I often walk past there in between classes). This was supposedly the highest paid apartment in New York to date...(not sure about that anymore?)

Either way it still is a renters market, in NYC, from my understanding. Though if indeed the economy is in recovery, perhaps this will change. Though with Job's numbers barely improving and housing still at its lows, I don't expect any big changes within the next few quarters.


**This is important since it is time to hunt for apartments!!**
-----

Alexander Lê
Managing Partner
Analyze Capital LLC
email: AnalyzeCapital@gmail.com

Friday, April 16, 2010

Housing Starts/Financials- 04.16.10


Via Bloomberg:

Housing in March strengthened from snow bound February-with permits pointing toward even better improvement than starts. Housing starts in March rebounded 1.6 percent after a snow storm damped 1.1 percent rise in February. The February number was revised up from an original estimate of a 5.9 percent drop. The March annualized pace of 0.626 million units came in above analysts' projection for 0.605 million units and was up 20.2 percent on a year-ago basis. The boost in March was led by an 18.8 percent jump in multifamily starts, following a 21.6 percent fall in February. The single-family component edged down 0.9 percent after a 5.7 percent boost the month before.

The impact of weather on February's numbers clearly was seen again in March as the latest surge was entirely from a rebound in the South which was battered by snow storms the prior month. By region, the March boost in starts was led by an 18.2 percent rebound in the South after an 11.8 percent drop the month before. For the latest month, declines were seen in the Midwest, down 28.4 percent; the Northeast, down 8.3 percent; and the West, down 2.1 percent.

Permits were even more positive, jumping 7.5 percent, following a 2.4 percent advance in February. The March pace of 0.685 million units annualized was up 34.1 percent on a year-ago basis.

Today's numbers indicate that housing is not slipping back into recession although this sector is still getting support from homebuyer tax credits that are about to expire. On the news bond yields firmed slightly and equity futures nudged up.


This report is dull. The big news in the markets today was earnings (BAC and GE) and SEC probes. BAC reported $3.18 B worth of Net Income or $0.28/share on $31.97 B of revenue, down 11% QoQ. The XLF was off -3.77% with Citi getting crushed, down -4.57%. Also, BAC was off -5.39% to finish at $18.43/common share.

Over the weekend, I have a massive accounting project to work on (M&A accounting- equity method). I will try to update the blog if I have any time. Today the markets definitely caught some traders with their pants around their ankles. Take the weekend to reevaluate positions and/or strategies going forward.


Patrick M. Ambrus
Managing Partner
Analyze Capital LLC
ambrus.anlzgroup@gmail.com

Thursday, April 15, 2010

Initial Jobless Claims- 04.15.10


Via Bloomberg:

Claims continue to pile up due to special administrative factors. Initial jobless claims jumped for a second week, up 24,000 in the April 10 week to 484,000. The four-week average is up 7,500 to 457,750 but is still a bit below the month-ago level. Continuing claims for the April 3 week rose 73,000 to 4.639 million, a level that is also the four-week average. Here too, the four-week average is a bit below the month-ago comparison.

The Labor Department attributes the rise in claims not to economic factors but to continuing administrative snags as offices catch up with claims during the shortened Easter week and, in California, for the Cesar Chavez holiday. The department is warning the next report may be affected by quarter-end reclassifications for emergency compensation, but that the chances for downward revisions are greater than for upward revisions.

Given all the noise in the data, expectations are likely to hold for a big gain in April payrolls, at least for now. Equities and commodities fell but only briefly in initial reaction to today's report.


It seems like every week there is a new excuse as to why the numbers are out of line on the high side and low side. I hope the large increase in claims is not attributable to economic factors as this report suggests.

Patrick M. Ambrus
Managing Partner
Analyze Capital LLC
ambrus.anlzgroup@gmail.com

Industrial Production- 04.15.10


Industrial production rose in March but fell sharply below expectations-but the shortfall was utilities related. Overall industrial production in March edged up 0.1 percent after gaining 0.3 percent the month before. The consensus had forecast a 0.8 percent boost for the month.

However, the manufacturing component was notably strong with a 0.9 percent jump, after advancing 0.2 percent in February. For the other major components, utilities output plunged 6.4 percent after no change the prior month while mining production increased 2.3 percent after rising 1.7 percent in February.

Within manufacturing, durables output jumped a sharp 1.4 percent with all major categories advancing, most over 1 percent. Nondurables production increased 0.5 percent in March, led by a 3.0 percent jump in petroleum & coal products and by a 1.7 percent gain in rubber products. Other increases were more moderate but still widespread.

On a year-on-year basis, industrial production rose to 4.0 percent from 2.2 percent in February.

Capacity utilization is gaining ground as it expanded to 73.2 percent from 73.0 percent the month before. The latest number came in a little below analysts' forecasts for 73.4 percent.

Despite the headline disappointment, the manufacturing sector remains robust-especially taking into account a healthy boost in the April Empire State manufacturing index earlier this morning. Markets had conflicting data to digest this morning with weak headline industrial production, a strong Empire number, and an unexpected jump in initial jobless claims. Given that special factors likely kept production and claims weak, markets should look past headline numbers. But heading into the open of U.S. markets, that is not the case with equity futures down.


The Capacity Utilization Rate continues to increase, which means more factories are being utilized for manufacturing on a monthly basis. Let's see if the CUR can't edge up to 75 /76 by June. Also, I am pleased to see a strong increase in durables output this month. Maybe this can be linked to the recent success of U.S. automakers Ford and General Motors? As expected, equities did not have much of a reaction to this mediocre report. No reason to be bullish based on these results.


Patrick M. Ambrus
Managing Partner
Analyze Capital LLC
ambrus.anlzgroup@gmail.com

Tuesday, April 13, 2010

International Trade Balance- 04.13.10


Via Bloombeerg:

Today's trade report suggests that businesses are a little more optimistic about domestic demand. The U.S. trade gap widened in February on both oil and non-oil imports. The trade deficit for February expanded to $39.7 billion from a revised $37.0 billion the month before. February's gap came in a little larger than the market forecast for a $39.0 billion shortfall. Exports rebounded 0.2 percent while imports made a 1.7 percent comeback.

The worsening in the trade deficit was led by the nonpetroleum balance which widened to $27.2 billion from $25.6 billion in January. The petroleum deficit came in at $22.9 billion, compared to $22.5 billion in January.

The source of the gain in nonpetroleum goods should give comfort to those worrying about business confidence in the consumer sector. The boost in imports primarily was the result of a $1.1 billion jump in consumer goods, followed by a $1.0 billion gain in industrial supplies (largely oil). But imports of capital goods excluding autos posted a moderate gain of $0.4 billion. Overall, businesses appear to be in a restocking mood-which is favorable to the economy.

Exports were up only marginally with major components mixed. Capital goods excluding autos were up $0.4 billion in January despite a $0.8 billion drop in the aircraft component. The food, feeds & beverage component showed the biggest decline, dipping $0.5 billion. Taking into account the fall in civilian aircraft exports, overall exports were good.

On a year-on-year basis, growth in overall exports of goods and services in February slipped to 14.3 percent from 15.3 percent in January. Meanwhile import growth jumped to 23.3 percent in February from 13.7 percent the month before.


I am encouraged to see retailers restock their supplies which in turn means consumers are buying again. Hence, are banks extending more lines of credit as the economy improves? I will look to JPM's earnings on Wednesday and BAC's on Friday to help confirm or reject this hypothesis. Specifically, I will look at new issuances of consumer (credit cards) and small business loans.

On the other hand, I am not thrilled to see a decrease in net exports (exports - imports). The global trade balance needs to rebalance itself in order for a proper global recovery to manifest; including job creation. Maybe these numbers reflect the lush liquidity which continues to bath the U.S. Economy.

Will The S&P 500 break 1200 Today? Equity markets are choppy this morning. Good luck trading!


Patrick M. Ambrus
Managing Partner
Analyze Capital LLC
ambrus.anlzgroup@gmail.com

Sunday, April 11, 2010

Finals Week Approaching: Thoughts - April 10, 2010

Finals week is approaching for the Partners. We all will be intermittently updating on markets, though mainly Pat and my own focus is on graduating. Once graduated business increase exponentially. It has been a long journey, and just as one ends a new one begins.

Taxes for 2009 have just been filed and things are looking good. 2010 should be an even better year.

brief market thoughts:

SPX:

I've been completely wrong in the short term (for all of march) even though my price target of 1200+ has been right. It seems markets want to see beyond the 1200+ level without a retracement before touching resistance levels. It seems my convictions on the SPX were more bullish than market participants, as in a pull back would have been healthier for the overall uptrend. It seems if resistance does indeed hold at the 1200 levels the pullback will be greater than 5% imho.

Dollar:

Dollar is still in a downward whipsaw short term trend if one is still bullish on the dollar for the second quarter. How much lower can it go? With barely budging economic fundamentals around the world, this temporary dollar weakness may last well into the second quarter. I haven't been monitoring the situation too closely since my laptop's motherboard has melted recently. Ill be waiting to return to markets once I purchase my new computer.

----

Alexander Lê

Managing Parnter

Analyze Capital LLC

EmailAnalyzeCapital@gmail.com

Finals Week Approaching: Thoughts - April 10, 2010

Finals week is approaching for the Partners. We all will be intermittently updating on markets, though mainly Pat and my own focus is on graduating. Once graduated business is expected increase exponentially. It has been a long journey, and just as one ends a new one begins.

Taxes for 2009 have just been filed and things are looking good. 2010 should be an even better year.

brief market thoughts:

SPX:

I've been completely wrong in the short term (for all of march) even though my price target of 1200+ has been right. It seems markets want to see beyond the 1200+ level without a retracement before touching resistance levels. It seems my convictions on the SPX were more bullish than market participants, as in a pull back would have been healthier for the overall uptrend. It seems if resistance does indeed hold at the 1200 levels the pullback will be greater than 5% imho.

Dollar:

Dollar is still in a downward whipsaw short term trend if one is still bullish on the dollar for the second quarter. How much lower can it go? With barely budging economic fundamentals around the world, this temporary dollar weakness may last well into the second quarter. I haven't been monitoring the situation too closely since my laptop's motherboard has melted recently. Ill be waiting to return to markets once I purchase my new computer.


----

Alexander Lê
Managing Parnter
Analyze Capital LLC
EmailAnalyzeCapital@gmail.com

Saturday, April 3, 2010

Android is gradually taking over the smartphone (OS) market?

At&t companied with iPhone has been dominated the smartphone market in the United States since June 29th, 2007 for more than two years, until the new star, Android, which brought up by Google joined the battle. The competition between iPhone and Android is not simply among smartphone, but rather than a match of mobile operating system (OS). Smartphone is known for the convenient internet access ability. Therefore, when we talk about smartphone (OS) market-share, one of the most important number is the web traffic share.


The graph* above is the interent traffic share of mobile OS, including Apple’s iPhone OS, Google’s Android, Blackberry’s RIM. Palm’s webOS, and Microsoft’s Windows Mobile. June 2009, which was right about 2 years from the first iPhone released, iPhone had a nearly 70% of mobile OS traffic share, whereas Android entered the market not long ago and was at the same level as other mobile operation systems. That is the time when Google partnered more cell phone companies and started to release a decent amount of Android Phones. Majority always has a greater power over a single one, soon iPhone’s market share was declining due to the increasing of Android Phone models. By the beginning of February this year, Android and iPhone OS have nearly the same interent traffic share, which is about 45% each. Another thing that the graph illustrated, is how innovation in smartphone operating system affect the traffic share. Palm had a small improvement due to the new webOS, whereas Blackberry and Microsoft were dropping dramatically. Nevertheless, according to recent news and technology conferences, Blackberry will update the systems soon, as well as Microsoft will have some Windows Phone 7 released this year Thanksgiving or Christmas. No doubt that the battle among smartphone (OS) will be more intense later this year.


This graph* above shows the same competition but world-widely. While Symbian that is supported by Nokia has losing the its market-share sharply, iPhone OS and Android are taking over the pie. Nonetheless, just as Microsoft and Blackberry, a new Symbian system has been announced not long ago, but will that make a comeback or just a dying struggle?
What is your thought on this? Which OS will you vote for?
  • iPhone OS - Apple
  • Android - Google x HTC/Samsung/LG/Motorola/Acer/Dell/Sony Ericsson, etc.
  • Symbian - Nokia/Sony Ericsson/Samsung, etc.
  • RIM - Blackberry
  • webOS - Palm
  • Windows Mobile - HTC/Samsung/LG/HP/ASUS, etc.

* graphs via ars technica
--
Clark Chu
Managing Partner
Analyze Capital LLC
 
Disclaimer
This Blog has been developed by Analyze Capital LLC, and as an independent organization we provide “AS IS” information without warranty. The ideas and opinions expressed by the contributers of this blog are personal and do not represent the actions or policies of Analyze Capital LLC. The contents of this blog do not intend to assert recommendations or to offer advice of any kind. We are not responsible the consequences, be they gains or losses, that may result from using any of the information from this blog.