rss
email
twitter
facebook

Thursday, December 31, 2009

Happy New Years!


On behalf of Analyze Capital LLC

Happy New Years !

Looking forward to the best of 2010 and great success!


----

Alexander Lê
Managing Partner
Analyze Capital LLC
email: le.alex48@gmail.com

Wednesday, December 30, 2009

Daily Currency Update: 12.30.09

CAD - UP
AUS - UP

GBP - DOWN
EUR - DOWN
JPY - DOWN


-----

Corr's:

Oil - Down
Equities(SPX) - Down
Gold - Down

-----


Im getting the feeling of four distinct fundamental regional differences among the major pairs vs the dollar.

AUS region moving on Asian/Commodity fundamentals (AKA mostly Chinese demand story)

CAD's contraian move vs the other pairs is due to domestic growth prospects from domestic and foreign activities

EUR and GBP are linked to the monetary/economic story along with the US

and

JPY, like CAD is due to local economic health.


Fundamentals seem to show that correlations are on the down slope of the curve (double check via simple HRA bloomy corr graphs). If this is true we will see correlation relationships bending over the next few months.


-----

Alexander Lê
Managing Partner
Analyze Capital LLC
email: le.alex48@gmail.com

-----

****note from management****


The managing partners are currently abroad extending networks across the UK, Japan, and Eastern Europe.


We apologize ahead of time for the slow responses to blog comments and lack of posts. Though come mid January we will resume the normal schedule and updates.


-----


If there are any urgent matters forward emails to one of the partners:


Analyze Capital LLC
Managing Partners
Alexander Lê: le.alex48@gmail.com
Pat Ambrus: ambrus.anlzgroup@gmail.com
Clark Chu: zhuzihao@googlemail.com

Tuesday, December 29, 2009

Trading Game Contest Update: 12.29.09


Jet lagged out of my mind, so might as well do some work...

Looks like the markets are going against everyone who is actively trading. The cash holders/non-traders are still in the lead with Dextor and Clark leading once again.

Trrodeli

Surprisingly in third place the underdog trrodeli is holding down third place. This is probably a reflection of his diversified portfolio over 4 equities of INTC, BAC, GE and NKE. Having four industry distinct equities may have helped him reduce the volatility in his portfolio.

On a technical picture, it seems GE and BAC are against him short term. While NKE and INTC have potential for breakout stocks (breaking of resistence) to the upside in a short time frame (1-2 weeks). Overall this may leave his portfolio at the same levels as they are now over the next few weeks.

Mico4578


In fourth place Mico has a small amount of capital in NVDA. Overall, on a technical basis NVDA has potential to garner profits, however in the short term it is in mid correction and will be hurting Mico performance in the interim. For the given time frame, if Mico wishes to increase his risk he could invest more in NVDA or create some more tech oriented plays involving peers or competitors.


lealex48

In fifth place I finally have made a right call in my position correcting itself. 200 SMA is acting as beautiful support. I don't expect this to be a smooth correction. It is tempting to cut my losses now as I have recovered 50%+ of my losses at this point and reassessing new entry points. But in the short term my system analysis is telling me price momentum is to the upside in the short term.

I will try and watch the charts closes and avoiding another trading disaster such as my "C" <-- (click here)> trade from the last game.


Dark_Trader


It looks like the Dark traders C position is starting to correct itself. Just like my EUR position, entry timing was poor. Both trades could have been vastly improved with more careful technical entry analysis.

Overall, though short term is starting to look attractive. I see prices having room to the upside to 3.72 before encountering resistance. Which means Dark_Trader may recover 100% profits and may make a 7.5% profit. Unfortunately the C position is only about 13% of the value of the portfolio.

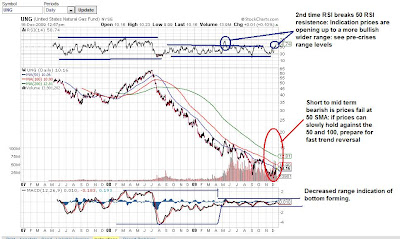
His major position of UNG moved further against him from 10.68 (when I last reported) to 10.85 on a short position. However, short term the picture is slowly starting to correct, though I still believe a bit of room to the upside (via RSI). All in all, it is possible he can recover 90% of his trade to the low 10's when UNG corrects, the big question is if he believes prices can break below 50 day SMA. If not perhaps this is a bottom for nat gas? (watch the higher highs). If prices break below support perhaps he can end up in profit though the odds are against him on the technical side or are at least more to the ambiguous side.


So there are your update brief trading technical tips:


"May the trade be with you"


-----

Alexander Lê
Analyze Capital LLC
Managing Partner
email: le.alex48@gmail.com

-----

****note from management****


The managing partners are currently abroad extending networks across the UK, Japan, and Eastern Europe.


We apologize ahead of time for the slow responses to blog comments and lack of posts. Though come mid January we will resume the normal schedule and updates.


-----


If there are any urgent matters forward emails to one of the partners:


Analyze Capital LLC
Managing Partners
Alexander Lê: le.alex48@gmail.com
Pat Ambrus: ambrus.anlzgroup@gmail.com
Clark Chu: zhuzihao@googlemail.com

Sunday, December 27, 2009

Management Announcment 12.27.09

The managing partners are currently abroad extending networks across the UK, Japan, and Eastern Europe.


We apologize ahead of time for the slow responses to blog comments and lack of posts. Though come mid January we will resume the normal schedule and updates.


-----


If there are any urgent matters forward emails to one of the partners:


Analyze Capital LLC
Managing Partners
Alexander Lê: le.alex48@gmail.com
Pat Ambrus: ambrus.anlzgroup@gmail.com
Clark Chu: zhuzihao@googlemail.com

Friday, December 25, 2009

Happy Holidays and New Years


On behalf of everyone at Analyze Capital LLC, we all would like to wish our readers, followers, and fellow lord traders a very warm happy holidays and new years.


A big thanks to all of you who helped us get us this far and best wishes as we all forge on into a new prosperous 2010!


"MAY THE TRADE BE WITH YOU"


----

Alexander Lê
Analyze Capital LLC
Managing Partner
email: le.alex48@gmail.com

Wednesday, December 23, 2009

Contest Update for 12.22.09


Lealex48

This is for the 22nd where yesterday major pairs were down against the dollar. Today it is the opposite with Dollar down (equities up) with a positive net change.

It is starting to show that I am slowly recovering losses. It is most likely that this trade will result in a small lost.

(Entry FXE: 146 to lows of 142 and now back around 143).

Dark_Trader

Dark_Trader is still struggling with his C position where he bought in at 3.46 and prices are now at 3.27. I had much trouble with C over a long term last trading game, so I opted not to trade this since this game's time frame is much longer and I am on partial vacation. Trading C requires much more needed vigilance from my experience.

In terms of his UNG trade it is also going against him currently (short entry at 10.08 and current at 10.68). It seems prices are being supported by short term 50 SMA interaction. Overall, there is a high probability that prices will fail and break below the 50 SMA if Nat Gas is still in a down trend. The issues is I see the prices being supported for at least another 1 to 2 weeks.

Dextor and ClarkChu

Both are leading with strong cash positions. But this won't be enough to get ahead of others for this contest in the given time frame like last game.


If you wish to join the game shoot me an email. Cash prize will be awarded.


-----

Alexander Lê
Analyze Capital LLC
Managing Partner
email: le.alex48@gmail.com

Daily Currency Brief: 12.23.09

Today I will consider entry for shorting the dollar against major pairs for a short time frame 1-2 weeks or more depending on what the charts tell me. I have to double check my indicators and systems. Overall the EUR seems to be the most volatile at a glance though I feel the major pairs are correlating off US fundamentals.


At these levels I have recovered about 50% of my losses on the EUR. A reversion back to a mean. The question is which mean are we following now? Lots of evidence (evidence of strong volume confirmation and short term SMA downward pressure) points to a trend change so I will considering cutting losses if my technical setup indicates and quick moves to the downside, if prices continue to correct to the upside. The problem is the markets are very volatile and have high probability to getting trumped by fundamentals.

This will be a very delicate play with light volume going into holiday season.

----

Alexander Lê
Analyze Capital LLC
Managing Parnter
email: le.alex48@gmail.com

Friday, December 18, 2009

Where is Miss Cleo?- 12.18.2009


The Dark_Trader Took a bit of a hit yesterday. Currently, I am short Nat Gas and long Citi. I am encouraged by today's action, and the charts confirm my positions. It now becomes a waiting game. Though, my sentiment has yet to change. I am currently examining the fundamentals of S&D on the Nat Gas trade to see if I can find any underlying indicators.

C is undervalued at these levels. Regardless if the financial system tanks C will be bailed out. Also, the street sold off the stock after an under-priced equity offering. Hence, it may take more time to exit the Troubled Asset Relief Program. I will continue to exam Citi's financial statements as well as weekly charts with my colleague Alex. This is what he had to say on October 30th when evaluating his position:

"Overall 3rd quarter fundamentals will prove to shine better in 4th quarter. C will be a better hold on the longer term out."

My sentiments to a T.


Patrick M. Ambrus
Analyze Capital LLC
Managing Partner
ambrus.anlzgroup@gmail.com

FX Daily Curreny Update: 12.18.09

After taking a few big hits on the EUR, I'm getting a better feel for the current conditions after a prolonged absences. Often it can be quite beneficial for a swing play to take an initial hit to establish the correct direction of the trend.

From a swing perspective, many of the major pairs are starting to look attractive for short term plays (short USD: 1-3 week). I will be waiting for further strength of the dollar, and waiting for more indicator and trend confirmation across the board before considering any shorts on the USD.

Pairs I am now considering:

GBP
AUD
JPY
AUD

and I have to reassess the EUR, but based on correlation I might as well add it to the list.


---

Alexander Lê
Analyze Capital LLC
Managing Partner
email: le.alex48@gmail.com

Gold Women Sheep: Hedge your Bets Kids - 12.18.09


Gold, Women and Sheep... You pick I'll leave my judgment out of this one for professional's sake.


** On a side note:

I maybe "diversifying" into one of the latter after taking a HUGE hit on the EUR. At this point I must admit complete utter defeat on this trade. Its times like these that makes a trader's job hard as to wait for a pull back and take a slight lost which entails risking further lost OR Cutting losses now.

Common Mistakes of young traders:

  • cutting profits too early and holding on to loosing trades for too long.

    Even with this in mind Im seeing a test at 1.42 which should hopefully hold, where I can catch a slight whipsaw minimizing lost. I do have a tight stop below support levels.


    ----

    Alexander Lê
    Analyze Capital LLC
    Managing Partner
    email: le.alex48@gmail.com
  • Wednesday, December 16, 2009

    How Corporate America Works: Bankers > President?? - John Stewart Reports - 12.16.09

    The Daily Show With Jon StewartMon - Thurs 11p / 10c
    Clusterf#@k to the Poor House - Flight Delay
    www.thedailyshow.com
    Daily Show
    Full Episodes
    Political HumorHealth Care Crisis


    Lloyd Blankfein, John Mack, Richard Parsons Ditch on Obama


    LOL


    Enjoy, we all can use a laugh in times of high uncertainty and stress.


    -


    Alexander Lê

    Analyze Capital LLC

    Managing Partner

    email: le.alex48@gmail.com

    UNG - Nat Gas - Technical Notes - 12.16.09

    Red Box = Bearish note
    Blue Box = Bullish note

    (mind the time frames are different on each box: email me for clarification, don't have time to explain each point at the moment)


    I put my technical notes above on natural gas. You tally the points up and you make your thesis.

    Ill say this though. Short to mid term it will be hard to justify a long (perhaps look to fundamental reasons seasonality, supply/demand factors...for justification).On a technical basis the evidence isn't there for a long in those time frames.

    Short term (of a few weeks) says prices down. Though looking at shorter and longer frames shows evidence of a trend change.

    The other day XOM bought out XTO. Now that is very hard to ignore fundamentally. Overall, natural gas has monster bullish potential monthly-quarterly basis into 2010.

    But anyway here's my tally:


    AC and The Lord of trading traders will be having a Natural Gas discussion soon here --> Natural Gas Discussion (click here)

    and now back to studies for finals!


    -----

    Alexander Lê
    Analyze Capital LLC
    Managing Partner
    email: le.alex48@gmail.com

    Tuesday, December 15, 2009

    Trading Game Update: 12.15.09


    The game hasn't updated its end day results.

    • As you can see I am down, which is explained by my previous post.

    • Pat is currently locked in a energy trade.

    • Clark has yet to open up a trade, though it is most likley he will trade tech equities.


    If you wish to join the game short me an email. Cash prize will be awarded.


    -----

    Alexander Lê
    Analyze Capital LLC
    Managing Partner
    email: le.alex48@gmail.com

    FXE trade: jumping the gun - 12.15.09


    As my friend "Sauros" <--- click here pointed out; I am playing a dangerous game. I am trying to catch the whipsaw while long on the EUR.

    It seems for 3 straight trading days FXE has gaped down against me. Luckily I am not using a leveraged FX pair and only exposed to the general trend so my lost is at a minimal. But, Id hate to imagine it what it would be like on an open fx leveraged trade.

    It seems that the EUR participants are factoring in more US econ data, a fundamental valuation perhaps is changing. This is the third significant gap down day of dollar up SPX up.

    After reviewing a long chart, Perhaps Sauros is correct in being short longer term out on the EUR. The full discussion can be found here: " THE LORD OF TRADING <----

    Looking at the first 3 year chart we see 50 support on the RSI has held throughout this entire rally. Perhaps this is a foreshadowing that equities are due for a correction? But ... Perhaps not, as we have been seeing dollar up/down and SPX still goes up. There is an inherent bias for us equity markets. And what is this underlying factor?

    USD safe haven and confidence and that the US Fed will back up the US if the safe haven fails.


    Either way my trading notes can be found on the charts above...

    I am expecting a retrace back to 1.48 range and will reassess the fundamental factors to see if this is indeed a long term trend change or if this is just an interim correction.


    -----

    Alexander Lê
    Analyze Capital LLC
    Managing Partner
    email: le.alex48@gmail.com

    Monday, December 14, 2009

    The "New" Normal- 12/14/09


    "Greed is Good."

    --Gekko


    I'm not sure how I feel about BAC, C, and WFC all paying back the U.S. Treasury within a week's time frame. Does anyone remember how much trouble the US Gov gave GS, JPM, and MS about repaying Tarp? Stress Tests anyone?


    Either the U.S. gov needs the liquidity or the media doesn't care about "Taxpayer money" anymore. Though, one cannot make the argument that BAC, WFC, and C are "healthy" institutions. "Healthy" banks don't egregiously need to dilute their shareholders. Milton Friedman anyone? Sheila Bair and Meredith Whitney would agree.


    Patrick M. Ambrus

    Analyze Capital LLC

    Managing Partner

    ambrus.anlzgroup@gmail.com

    Dress For Success- 12/14/09


    "I don't throw darts at a board. I bet on sure things. Read Sun-tzu, The Art of War. Every battle is won before it is ever fought. "

    --Gekko


    Econ Data for the week. I left out housing starts as well as energy numbers. I will blog on them if I have time later.


    Tuesday:


    PPI


    Producer Price Index comes in tomorrow morning at 8:30. I am particularly interested in seeing the finished goods data. This should give investors enough information to gauge overall growth in the economy. Also, if numbers come in better then expected we can look for a continuing trend in CPI. Hence, putting pressure on the Fed to raise rates. However, that probably will not happen any time soon. Just wishful thinking. Look for Dollar strength if the numbers are good.


    Via Bloomberg:

    Market Consensus Before Announcement

    The producer price index increased 0.3 percent in October after dropping 0.6 percent the month before. The rise in the latest month was led a 1.6 percent boost in energy and a 1.6 percent gain also for food. But at the core level, the PPI rate unexpectedly dropped 0.6 percent, following a 0.1 percent dip in September. The fall at the core level was due mainly to declines in prices for light trucks and passenger cars. Looking ahead, there is still upward pressure on the headline figure from higher oil prices. Imported petroleum prices were up 6.2 percent in November. Also, seasonally adjusted spot prices for West Texas Intermediate increased 6.9 percent for the month.


    Industrial Production

    If the numbers show economic growth look for this to spur a sell off in Treasuries.


    Bloomberg:


    Market Consensus Before Announcement Industrial production in October edged up only 0.1 percent, following a 0.6 percent boost the prior month. However, the manufacturing component declined 0.1 percent, following a 0.8 percent jump in September. Overall capacity utilization in October continued its rise from the historical low set in June, posting a gain to 70.7 percent from 70.5 percent in September. Looking ahead, earlier-released manufacturing indicators mostly suggest improvement in industrial production for November. From the employment situation, production worker hours in manufacturing were up 0.4 percent for the month. Key manufacturing surveys were in positive territory for November-including ISM, Philly Fed, and Empire State.


    Wednesday:


    CPI

    Any inflation on the horizon? This number coupled with bullish PPI could re-fuel the St. Nick rally.


    Bloomberg:


    Market Consensus Before Announcement The consumer price index in October firmed to a 0.3 percent boost after rising 0.2 percent the month before. Core CPI inflation was unchanged with a 0.2 percent increase. Boosting the headline number was a 1.5 percent jump in energy prices. Food price inflation was restrained in October with a 0.1 percent rise. Looking ahead, there is still upward pressure on the headline figure from higher oil prices. Imported petroleum prices were up 6.2 percent in November. Also, seasonally adjusted spot prices for West Texas Intermediate increased 6.9 percent for the month.


    Fed Decision


    I want to know when Bernanke plans to wind down QE or if there is even a plan in place for this. Specifically I want clarity Mortgage backed asset purchases program. How will the Dollar react? Does the FOMC support recent USD strength?


    Thursday:


    Initial Jobless Claims

    Will we see 5/6 positive weeks or a second consecutive week of losses?


    Bloomberg:


    Market Consensus Before Announcement Initial jobless claims for the December 5 week ended five weeks of improvement, rising 17,000 to 474,000 for the highest level since mid-November. But the four-week average improved, dropping 7,750 to 473,750. Continuing claims in data for the November 28 week fell very sharply, down 303,000 to 5.157 million. The drop in continuing claims reflects an uncertain mix of new hiring and the expiration of benefits.


    Patrick M. Ambrus

    Analyze Capital LLC

    Managing Partner

    ambrus.anlzgroup@gmail.com


    Friday, December 11, 2009

    Hunger For More- 12/11/09


    "Well, ladies and gentlemen we're not here to indulge in fantasy but in political and economic reality. America, America has become a second-rate power. Its trade deficit and its fiscal deficit are at nightmare proportions."

    --Gordon Gekko

    IEA Oil Market Report Highlights:

    Forecast global oil demand is virtually unchanged for 2009 at 84.9 mb/d but is revised up by 130 kb/d to 86.3 mb/d in 2010. Yearly growth (‐1.4 mb/d and +1.5 mb/d, respectively) remains driven by non‐ OECD countries, but OECD prospects have slightly improved.

    • OECD industry stocks fell by 36 mb in October to 2,735 mb, 2.5% above 2008’s level. Middle distillates accounted for over 40% of the draw, yet global products in floating storage continued to rise in October and November. End‐October forward demand cover fell to 59.4 days, 2.5 days higher than a year ago.

    • Global oil supply rose by 200 kb/d in November. OPEC crude production increased by 135 kb/d to 29.1 mb/d, its highest level in a year. Largely as a result of lower non‐OPEC supply prospects for 2010, next year’s call on OPEC is raised by 0.5 mb/d to 29.0 mb/d, compared with 28.7 mb/d in 2009.

    • Forecast 2009 non‐OPEC supply is raised by 125 kb/d to 51.3 mb/d as Russian gas liquids output is revised up. In addition, the end of the quietest US hurricane season since 1997 has contributed to lift this year’s outlook. By contrast, 2010 supply is revised down by 265 kb/d to 51.6 mb/d, with North American supply now lower.

    • Projected global 4Q09 refinery crude throughput is revised down by 0.6 mb/d to 72.3 mb/d, due to weaker US preliminary data and higher maintenance in Asia and the Middle East. Global 1Q10 crude throughput is seen rising by 1.0 mb/d year‐on‐year to 72.7 mb/d, but OECD crude runs are expected to fall given weak refining margins.

    • Crude oil futures prices traded in a higher $75‐80/bbl range in November before weakening in early December on fears that the recovery in the global economy could be shallower and slower than expected, especially in the key US market. Prices were trading at eight-week lows of around a $70‐74/bbl range at the time of writing.

    • A medium‐term market update sees upward revisions for demand (largely non‐OECD Asia) outstripping those for supply (Russia, OPEC NGLs and Nigerian and Iraqi capacity). Yet higher OPEC capacity ensures similar market outlooks – tightening under the higher GDP case, but remaining comfortable under lower GDP growth or faster efficiency gains.

    It looks like my colleague Alex is correct to be an oil Bull. One must also exam U.S. EIA numbers as well as OPEC numbers to get a better understanding of the numbers above. Though, this report does give a pretty good picture on the demand story. China's beak is wet I presume. If China continues to grow, they will continue to consume oil. I will look to see how domestic oil refiners are operating in order to gauge future consumption. If I like what I see I will look to enter my USO position around $70/barrel after incorporating technicals as well.

    CO1 - Crude - Brief Technical Review - 12.11.0


    I just want to do a brief commentary on the overall trend of Crude. I forgot to grab CL1 of the bloomberg but CO1 works just as well. Its clear via the first and second BB analysis that prices need to revisit back up to the mid to high 70's before establishing a concrete trend.

    In other words: "short term bull" until price range of 75+

    Relation to Equities and correlation thoughts:


    If you look at the month of november CO1 traded similarly to the SPX. A flat trend developed with a range of about 75 to 80 which eventually came to a price squeeze (currently spx is experiencing a price squeeze). Interestingly enough the price squeeze with oil led to the downside (prices currently around low 70's). The break to the downside could possibly be explained by the trade data. My colleague Pat put up a excellent post <-- click here on this a few days ago. To an extent the SPX followed, as prices went from 1100+ and fell to 1090, but held at 1085 support (continuing a flat trend/side ways trading) which exhibits a limited correlation. (in other words playing the equity oil corr may not be such a good idea).

    Price Behavior:

    Much of this flat pricing/sideways price behavior in NOV oil trading can also be explained by seasonality factors (weaker demand: seen via trade data). Interestingly enough though, winter is yet to be in full force. Crude will probably be in the 70's range through first Quarter 2010.

    Crude the past few quarters has tended to make wide higher highs on a monthly basis. Overall, the long term general trend on a quarterly basis is bullish. If Oil can maintain in the 70's range for the first quarter, establishing a new range in Q2 is quite possible when seasons change and demand picks up.


    Summary:

    Short Term: trade up to 75+ re-examine
    Mid Term: ? to lateral
    Long Term: on a quarterly basis bullish if ranges hold


    ----

    Alexander Lê
    Analyze Capital LLC
    Managing Partner
    email: le.alex48@gmail.com

    Currency Daily Update - 12.11.09

    Very Interesting open this morning. I have an open position on the EUR and it seems we are seeing Dollar up and Equities up.

    Now I know this is only a intra-day, but we saw a similar dynamic back in the first week of Dec. It will be interesting to see if this will re-correct over the next few days back to Dollar down and Equities up.

    If this Dollar up Equities up, keeps up perhaps markets are finally pricing in different fundamentals or we are seeing a divergence in monetary policies in the currency realm (USD relative safe heavem; flight to quality;? people pricing in early interest rakes for next year 2010?). Next week will be an interesting week.


    ----

    Alexander Lê
    Analyze Capital
    Managing Parnter
    Email: le.alex48@gmail.com

    Thursday, December 10, 2009

    Anaylze Capital November Trading Game Results


    As you can see most of our traders were smart and held on to cash positions (throughout the whole period....) and managed to get a return from interest.

    On the other hand, it is funny how the active traders all had positions in financials. The smart one was the Dark_Trader who was short throughout the whole period on financials. This initially hurt him in the beginning but paid off in the end due to his good discipline (as financials eventually tanked at the end of the month).

    I however did the exact opposite, I had a strong start by longing financial and did not follow up on tight risk management when i couldn't monitor markets and got killed.

    For a three week time frame I did terribly. Then again equity trading was never my strong point.

    Good news is that there is a December through February ANALYZE CAPITAL LLC equity trading game! (This time around ill stick to the currency related equities!)

    The game is up and currently running, if you wish to join the trading shoot me an email and ill send you an invite. The winner of this game will get a modest cash prize.

    All the participants and everyone from AC gives a warm congratulations to the Dark_Trader's success.

    ----

    Alexander Lê
    Analyze Capital LLC
    Managing Partner
    Email: le.alex48@gmail.com

    When the Money Goes, Will the Honey Stay?- 12/10/09


    "Money itself isn't lost or made, it's simply transferred from one perception to another. "
    -Gordan Gecko

    Via Bloomberg:

    Trade Report
    The latest international trade report shows exports continuing an uptrend, boosting U.S. manufacturing. Imports also rose, likely reflecting inventory rebuilding for autos and cautious hope about the consumer and business investment. The overall U.S. trade deficit narrowed to $32.9 billion from a revised $35.7 billion gap in September. The deficit was smaller than the market forecast for a $36.4 billion differential. Exports advanced 2.6 percent while imports gained 0.4 percent. The improvement in the trade deficit was primarily due to a narrowing in the petroleum deficit, which came in at $17.8 billion compared to a gap of $20.5 billion the previous month. The nonpetroleum gap shrank to $25.2 billion from $25.7 billion in September.

    Looks like the decline in oil prices coupled with depressed demand played a major role in the narrowing of the gap.

    But apparently, U.S. businesses are a little optimistic about domestic demand for both capital equipment and consumer goods. Import gains were led by a $1.1 billion boost in capital goods ex autos, followed by a $1.0 billion rise in consumer goods imports and $0.4 billion for autos. Industrial supplies imported fell $1.8 billion, with the crude oil component falling even more-by $2.4 billion. However, some of the auto imports may be lagged effects from the surge in auto sales under the cash-for clunkers program as import auto dealers restocked.

    If the consumer continues to spend we should see robust GDP growth in the 4th quarter. Though, I would be cautious to predict anything over the 3-3.5% forecast by Mr. Bernanke and Mr. Dudley of the Federal Reserve.

    Initial Jobless Claims
    Initial jobless claims ended five weeks of improvement, rising 17,000 in the Dec. 5 week to 474,000 for the highest level since mid-November. But the four-week average continues to improve and is right at the current level, down 7,750 to 473,750. Market News International also notes that seasonal contraction in construction, tied to heavy weather, is another offsetting factor in the latest week's rise. Continuing claims in data for the Nov. 28 week fell very sharply, down 303,000 to 5.157 million. The drop in continuing claims reflects an uncertain mix of new hirings and the expiration of benefits. The unemployment rate for insured workers continues to come down, 2 tenths lower to 3.9 percent. This rate peaked in July at 5.2 percent in a major contrast with the overall unemployment rate which, at 10.0 percent in November, hit a 10.2 percent peak in October. Today's report is a bit of a disappointment and will lend modest support to those who question whether the November jobs report, with its big improvement, will prove to be a fluke
    .

    Claims missed analyst Consensus estimates of 460,000 for the week. This will be a very important trend to watch over the month of December leading into the Employment Situation on January 8th. Additionally, these numbers will have the potential to avalanche the Santa Clause Rally. Specifically, I will look for action from Washington as Obama looks to subsidize jobs with left over Tarp money. If this action is taken it will probably be viewed as bearish on the economy.

    Natural Gas Inventories
    Natural gas in storage fell 64 billion cubic feet in the Dec. 4

    Nat Gas continued its volatility today and is up a whopping 7.7% at $5.28/btu on the session due to bullish supply numbers. I was able to lock in a favorable long position at the close of the trading day yesterday through the UNG. I have already taken profits today, and I will look to re-enter around $9.10.

    Other News & Notes
    • CIT exits Bankruptcy
    • Citi looks to raise $20B through common offering to help repay $45B Tarp loan
    • London bankers set for exile as Darling approves Bonus Tax in excess of £25,000
    • U.S. Treasury will extend the Tarp until October 2010
    On a a personal note, Tiger Woods is a great golfer and not a role model. Stop expecting him to live a flawless life. Everyone makes mistakes. I am sure Disney is loving ESPN's rating right about now. There is no news like Bad news...


    Patrick M. Ambrus
    Managing Partner
    Analyze Capital LLC
    ambrus.anlzgroup@gmail.com

    Note to self on consumption: 12.10.09

    I would like to see the trade data break down. Particularly I am interested in the % of retail that is high end. I would like to match that data to the amount of money spent by foreigners and its relation to some security like high end ETFs. In line I would like to see the same thing for % of certain income level families and there consumption patterns and relating in some way to again a high end ETF of some sorts...

    Perhaps there is value to be found in predicting what type of consumption is leading in this environment and if that is enough to lift retail/consumption spending for this holiday season.

    Though, there is a wealth of variants of information on this, I haven't had the time to dig through, research and/or analyze the data...

    -----

    On a side note, I know I have had a prolonged leave of absences due to admin and school work, but I am working on my next technical spx review which should be up by the end of today.

    Alexander Lê
    Managing Partner
    Analyze Capital LLC
    le.alex48@gmail.com

    Wednesday, December 9, 2009

    Money Never Sleeps, but People Do - 12.09.09


    Via Bloomberg:

    Oil whipsawed in reaction to weekly petroleum inventory data. On the negative side for prices are a large 2.5 million barrel build in crude stocks at the WTI delivery point at Cushing, Oklahoma together with a 2.2 million barrel build in total gasoline stocks and a 1.6 million build in distillates. On the plus side is a sizable 3.8 million draw in total crude inventories to 336.1 million barrels. Oil and gasoline imports were down in the week while domestic output of gasoline and distillates were both up. Refineries operated at 81.1 percent of capacity, up from the prior week but still very low. On the demand side, demand for gasoline was steady in the week while demand for distillates dipped. Oil first fell $1 then rebounded $1 to trade at $73 following today's data. Supply in the petroleum market, despite the week's draw in crude, is still very heavy and is a threat to the oil industry should the global economic recovery stall.

    If crude continues to stay in a lower range short term ($70-72) I will look to jump in via USO. Tomorrow we will get Natural Gas Inventories at 10:30.

    Tommorow's Action:

    The U.S. international trade gap in September widened to $36.5 billion from $30.7 billion worth of red ink in August. Exports rose 2.9 percent while imports jumped 5.8 percent. The worsening of the trade deficit was led by a wider petroleum shortfall which came in at $20.5 billion compared to $16.6 billion the previous month. The nonpetroleum gap increased to $25.9 billion from $24.3 billion in August. Looking ahead, the sneak peak indicators are mixed. First, there could be a drop in auto imports from Canada as not as many are needed with cash for clunkers having concluded. But a drop in shipments of nondefense capital goods in October could show up in lower capital goods exports. Also, higher oil prices will cut into any potential improvement in the trade gap.


    Consensus is -34.6B. I don't expect this to be much of a market mover unless the gap increases significantly. Data should be flat or slightly improve. If data is week I expect a dollar sell off.

    Also,Watch out for initial Jobless claims at 10:30. The combination of initial claims and trade deficit data have potential to move markets in either direction.

    It will be interesting to see how dollar strength or weakness influences equity investors for the rest of the trading week.

    On Friday we will get a real feel for how well the U.S. consumer is doing with retail sales and consumer sentiment reports.

    The ASX 200 and Nikkei 225 are sitting on slight gains to start the trading session in Asia, up .25% and .06% respectively. Futures are negative in the Eurozone and U.S. equity markets are poised to open slightly to the upside.


    Patrick M. Ambrus
    Managing Partner
    Analyze Capital LLC
    ambrus.anlzgroup@gmail.com

    Tuesday, December 8, 2009

    SPX Technical Inter-temporal Update - 12.08.09

    **Skip to Summary for quick conclusion:

    The Daily Chart (short term thoughts)

    Chart 1:


    Its been awhile, but I'll try and keep it brief. Some new develops I found interesting enough to write about with what little time I have with finals approaching:

    TRADER MIKE <-- click here

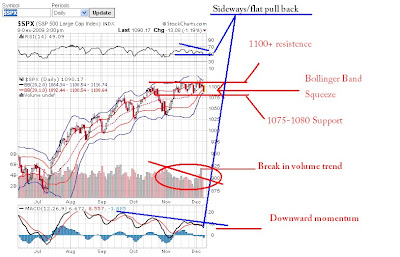
    Somewhere in one of Trader Mike's blogs he refers and as I paraphrase "to the SPX pulling back in a side ways fashion" ... If you do look at the support and resistance levels I drew out the SPX has been trading in a range. Evidence as a pullback despite static prices lies in falling RSI and downward momentum as seen in the MACD.

    RSI:

    Interestingly enough the RSI is still holding at 50 support. However, as we see from the beginning of November, the RSI does not manage to reach 70+ and fails around 60+ instead. This could possibly indicating a weakening of trend.
    IF 50 RSI breaks to the downside momentum can fall further.

    MACD:

    A weakening of trend can be confirmed by looking at the MACD's reversion to center-line balance at zero. (seen in Chart 1)

    Volume:

    Volume's downtrend can be indicative of a weakening trend as well. With the holiday season approaching, volume will be lighter and much uncertainty has yet to be priced in fully about holiday performance (esp. in the consumer sectors of the SPX).

    Though interestingly enough we see an abnormal spike around the day of the Employment announcement Dec. 4th. This abnormal spike (above the average volume)could show that that there are many bulls still around defending the 1100 line.

    Prices:

    All these indicators pointing to downward movements only have resulted in the SPX trading in a range. Bulls and bears are almost evenly matched reflecting the uncertainty in the markets. All this has led to a price squeeze for almost two weeks now, which will result in a big pop. The big question is if it is the upside or to the downside?

    To figure this out I look to the long term charts:

    Chart 2:


    Looking at the SMA evidence as shown above (chart 2). There is significant support for the short term seen in the Daily chart AND the weekly chart. Back in Nov prices flirted with the 50 SMA but have managed to stay above that level for over two weeks. This is reflected in the monthly chart as having Mid term support on the 100 SMA. These two support factors should give enough strength for prices to break through 1100 resistance within 2-4 weeks establishing a new uptrend.

    Chart 3:


    The chart above (chart 3) shows that, considering price alone, that if resistance is broken at 1100 there is room up to the high 1200's.

    Chart 4:


    Chart 4 shows that MACD although in the short term has been trending down as seen in Chart 1, the MACD shows a that markets might have possibly stabilized as "current post-recession (2008 issues)" MACD levels are similar to "pre-crises levels (before 2007)." The left side demonstrates that the possibility of a 1100 break in resistance existence with room for upward momentum to 20 (historical highs on MACD - pattern analysis points up). The tightening of the range IMHO is a good sign for bulls. **I stress however that this bullish move is on in a short term time frame of about 1 month+ or so (where prices would be between 1100 and 1300).

    I would also site the RSI shown in Chart 3 as having room to 70 "IF" a trend change is not taking place.

    HOWEVER

    Long term I would have to make a more bearish call which would coincide with strong resistance levels of around high 1200's along with 200SMA price resistance shown in Chart 2. This time frame would put me into mid second quarter or into 3rd quarter 2010.


    Summary:
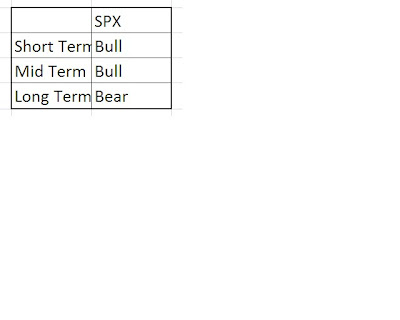
    Short Term: 2 weeks - 1 month: I expect a break in 1100 resistance to the upside.
    Mid Term: Into First Quarter 2010
    Long Term: Bearish into Second/Third Quarter 2010:

    --------------------

    ** I would like to note that MACD and RSI in short and long frames do point to room to the upside but are already in high level territory which means greater downside risk. Calling a break in resistance of 1100 is very risky considering the picture seems very toppy at the moment. However, I still stand behind my thesis and assess my performance moving forwards.

    **Disclaimer: this only involves look at technicals on the SPX and does not include other market influences such as Currency, Bond, Macro, Commodities, Central Banking Analysis.


    Alexander Lê
    Analyze Capital
    Managing Parnter
    Email: le.alex48@gmail.com

    Can't Tell Me Nothing- 12/8/09


    My intention of this post is not to criticize the system but to rather to question it.

    "I had a dream I could buy my way to heaven, when I awoke I spent it on a necklace...I feel the pressure I'm under more scrutiny and what I do, act more stupidly."

    --Kanye West, Graduation


    Today, Bankers in England must have their bonuses taxed. Bank of Ameria is exiting the TARP program so they can hire a chief executive who will be well paid. Citigroup desperately wants to exit the Tarp but has been denied thus far. Neil Kashkarian takes a new job at PIMCO to build up the Allianz-owned firm's equity business.

    These are all headlines from around the today's media. What is abnormal about the above? In short, nothing. Wall Street has not changed since the near financial Armageddon. Why should it? The systems in place were created by the current generation of bankers, traders, analysts, and fund managers. How can the the general public expect change when the current generation live, breath, and sleep meritocracy. The system has been constructed to "reward those who show talent and competence as demonstrated by past actions or by competition." Why is this wrong? Its not.

    However, politicians are scrambling to point the finger at firms that bathed in "excessive risk taking/leverage." What good does this do? I will be the first to admit Wall Street has much to be thankful for as we round out the Holiday season. Yet, If there was no Citigroup, AIG, Goldman Sachs, or Bailout inc. bonuses, the same politicians who persistently criticize the system would not be elected/re-elected/appointed.

    Washington and Politicians in general need to move away from their "old ways of doing business" if they truly want things to change. I believe in Capitalism. Though, I also believe in checks and balances. Maybe Finane got out of hand for a time, but that still does not justify the finger pointing blame game. The crisis was a perfect storm of poor regulation/risk taking/monetary policy/oversight/ratings/etc... Wall Street will not change unless Washington changes first.


    Patrick M. Ambrus
    Managing Partner
    Analyze Capital LLC
    ambrus.anlzgroup@gmail.com

    Thursday, December 3, 2009

    Scripting The Future- 12/3/2009


    Initial Jobless claims via Bloomberg:

    Highlights
    Initial jobless claims fell 5,000 in the Nov. 28 week to 457,000, extending a run of impressive improvement that points squarely at improvement for total payrolls (prior week revised 4,000 lower). The four-week week average is lagging despite falling 14,250 in the week to 481,250. Continuing claims for the Nov. 21 week rose slightly to 5.465 million with the insured-workers unemployment rate steady at 4.1 percent, well down from a summer peak of 5.2 percent. The slight gain in continuing claims hardly puts a dent into 10 prior weeks of improvement, improvement reflecting new hiring but also, and likely to a large degree, the expiration of benefits. Those receiving extended benefits rose nearly 60,000 to just under 600,000 in data for the Nov. 14 week. Markets moved higher but only briefly in reaction to the report, one that will firm expectations for solid improvement in tomorrow's November employment report.

    Initial claims were 28,000 less then consensus estimates from Bloomberg analysts. Are we finally leveling off? Probably not. However, I do expect to see Initial Jobless claims stay in the 450k-375k range for the remainder of 2009 and well into 2010.

    More to come later in the day...

    ---


    Patrick M. Ambrus
    Analyze Capital LLC
    Managing Partner
    ambrus.anlzgroup@gmail.com

    Tuesday, December 1, 2009

    The Good, Surprising, and Ugly


    The Good:
    "Sales of domestic light motor vehicles in October rebounded 17.2 percent to 7.8 million units as sales returned to normal-at least for the current recovery. Combined sales of domestics and imports in rose to a 10.5 million annualized unit rate from 9.2 million in September. Now that the monthly swings from cash-for-clunkers have been wrung out from the data, November will stand out as a possibly true measure of the strength of demand for motor vehicles and of the viability of the consumer sector to a large degree."


    Sales for the Thanksgiving Holiday were down about 1% from last year as consumers bargain hunted and held out for heavier discounts. Domestic Motor Vehicle sales for November may give an indication of what consumers are spending on if anything. Economists are predicting a consensus range of 7.5 to 8.0 million units sold. Hopefully, this will mark an upturn in domestic consumption overall.

    The Surprising:
    "Existing home sales got a giant boost in October from the pending expiration of the first round of buyer credits, a gain that raised questions whether sales rates were pulled forward and would dip in subsequent months. But today's pending home sales report points to continued strength ahead. Pending home sales jumped 3.7 percent in October to 114.1, adding to September's even more impressive 6.0 percent gain. Year-on-year pending home sales are up 31.8 percent. The housing sector appears to be moving off the bottom, underscored by the 4.4 percent rise in private residential construction also reported today at 10:00."

    The secondary market is picking up a bit. How much of this can be accredited to the potential tax-credit expiration? Additionally, how many of these homes have maintained timely payment schedules without restructuring or default?

    The Ugly
    "The construction sector continues to head in divergent directions with housing improving but being offset with declines in nonresidential and public outlays. Overall construction spending was unchanged in October after dropping a revised 1.6 percent in September. The unchanged figure for October came in higher than the consensus forecast for a 0.4 percent decline. Probably the biggest negative in the report is that September was revised down sharply from the initial estimate of a 0.8 percent boost. For the latest month private residential outlays jumped 4.4 percent after a 2.0 percent decline in September. In contrast, private nonresidential fell 2.5 percent in October while public outlays dipped 0.4 percent in the latest month."

    This is disappointing news considering the demand for existing homes. One could infer demand for new homes has not picked up due to plentiful layoffs and lack of employment opportunities. It is hard to start a family with no income. Additionally recent college graduates are still struggling to find jobs. I don't expect this number to pick up anytime soon until the demographic of 22-30 years find stable employment.


    Patrick M. Ambrus
    Analyze Capital LLC
    Managing Partner
    ambrus.anlzgroup@gmail.com
     
    Disclaimer
    This Blog has been developed by Analyze Capital LLC, and as an independent organization we provide “AS IS” information without warranty. The ideas and opinions expressed by the contributers of this blog are personal and do not represent the actions or policies of Analyze Capital LLC. The contents of this blog do not intend to assert recommendations or to offer advice of any kind. We are not responsible the consequences, be they gains or losses, that may result from using any of the information from this blog.